RD Sharma Solutions Chapter 7 Statistics Exercise 7.4 Class 10 Maths

Chapter Name | RD Sharma Chapter 7 Statistics |
Book Name | RD Sharma Mathematics for Class 10 |
Other Exercises |
|
Related Study | NCERT Solutions for Class 10 Maths |
Exercise 7.4 Solutions
1. Following are the lives in hours of 15 pieces of the components of aircraft engine. find the median:
715,724,,725,710,729,745,694,699,696,712,734,728,716,705,719.
Solution
Lives in hours of is pieces are
= 715, 724, 725, 710, 729, 745, 694, 699, 696, 712,734,728,719,705,705,719
Arrange the above data in a sending order
694,696,699,705,710,712,715,716,719,721,725,728,729,734,745
N = 15(odd) 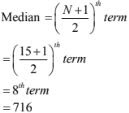
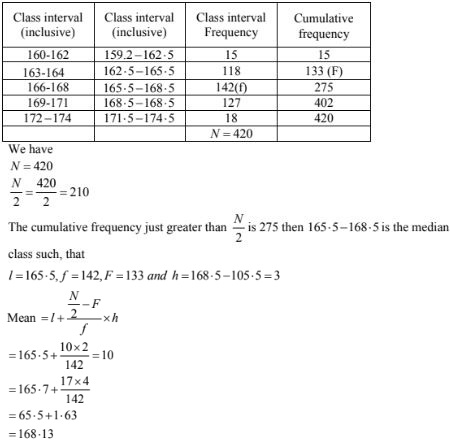
2. The following is the distribution of height of students of a certain class in a certain city.
|
Height (in cm): |
160 – 162 |
163 – 165 |
166 – 168 |
169 – 171 |
172 – 174 |
|
No. of students: |
15 |
118 |
142 |
127 |
18 |
Find the median height.
Solution
|
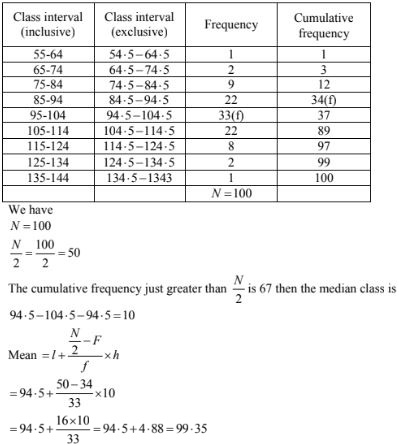
I.Q.: |
55 – 64 |
65 – 74 |
75 – 84 |
85 – 94 |
95 – 104 |
105 – 114 |
115 – 124 |
125 – 134 |
135 – 144 |
|
No. of Students: |
1 |
2 |
9 |
22 |
33 |
22 |
8 |
2 |
1 |
Solution
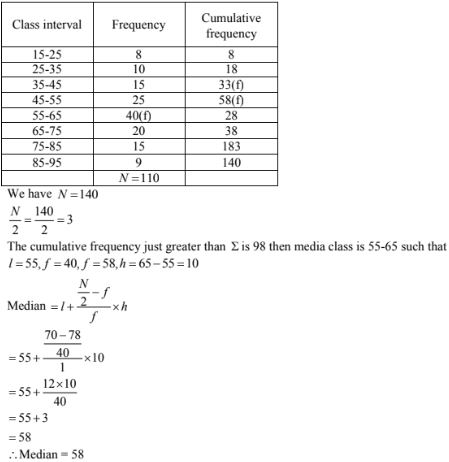
|
Rent (in Rs.): |
15 – 25 |
25 – 35 |
35 – 45 |
45 – 55 |
55 – 65 |
65 – 75 |
75 – 85 |
85 – 95 |
|
No. of houses: |
8 |
10 |
15 |
25 |
40 |
20 |
15 |
7 |
Solution
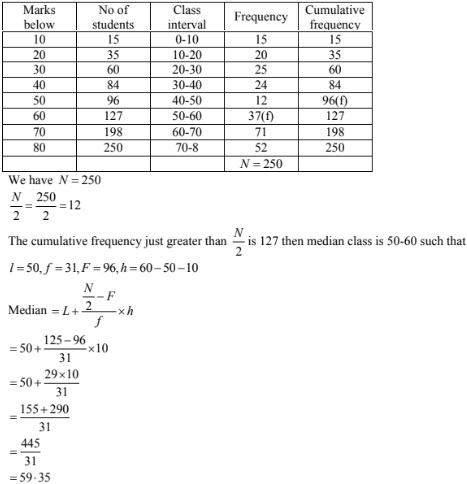
|
Marks below: |
10 |
20 |
30 |
40 |
50 |
60 |
70 |
80 |
|
No. of students: |
15 |
35 |
60 |
84 |
96 |
127 |
198 |
250 |
Solution
|
Variable: |
0 – 10 |
10 – 20 |
20 – 30 |
30 – 40 |
40 – 50 |
50 – 60 |
60 – 70 |
|
Frequency: |
10 |
20 |
? |
40 |
? |
25 |
15 |
Solution
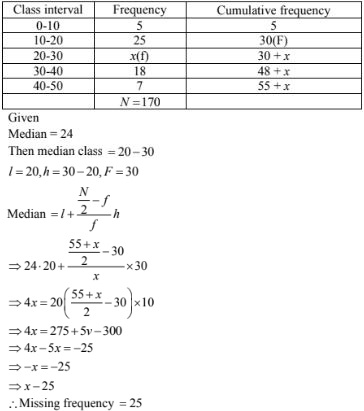
|
Age in years: |
0 – 10 |
10 – 20 |
20 – 30 |
30 – 40 |
40 – 50 |
|
No. of persons: |
5 |
25 |
? |
18 |
7 |
Solution
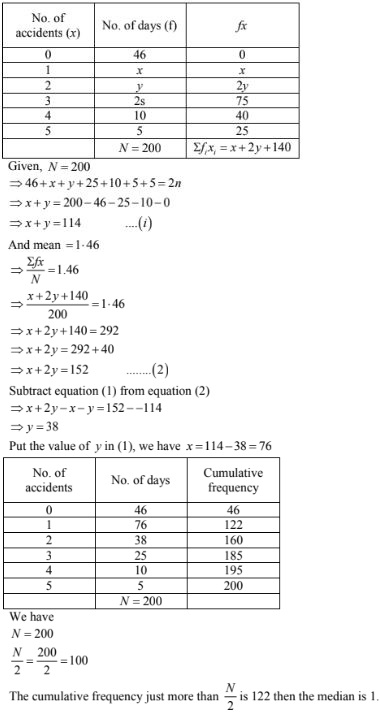
|
No. of accidents: |
0 |
1 |
2 |
3 |
4 |
5 |
Total |
|
Frequency (No. of days): |
46 |
? |
? |
25 |
10 |
5 |
200 |
Solution
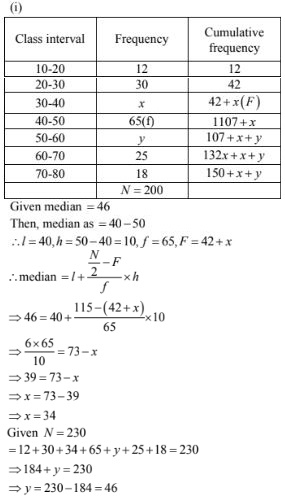
|
Variable: |
10 – 20 |
20 – 30 |
30 – 40 |
40 – 50 |
50 – 60 |
60 – 70 |
70 – 80 |
|
Frequency: |
12 |
30 |
- |
65 |
- |
25 |
18 |
You are given that the median value is 46 and the total number of items is 230.
(i) Using the median formula fill up missing frequencies.
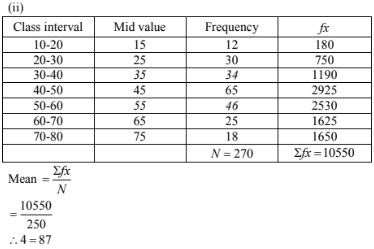
(ii) Calculate the AM of the completed distribution.
Solution
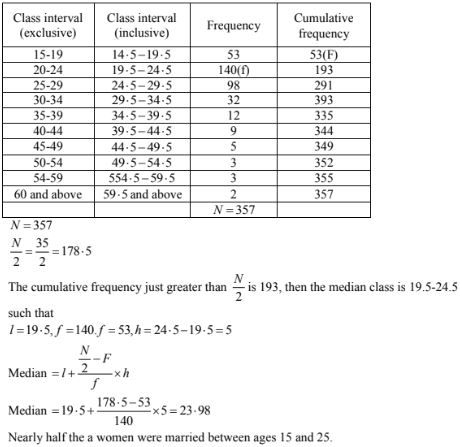
|
Age(in years) |
Frequency |
Age(in years) |
Frequency |
|
15 – 19 |
53 |
40 – 44 |
9 |
|
20 – 24 |
140 |
45 – 49 |
5 |
|
25 – 29 |
98 |
50 – 54 |
3 |
|
30 – 34 |
32 |
55 – 59 |
3 |
|
35 – 39 |
12 |
60 and above |
2 |
Calculate the median and interpret the results
Solution
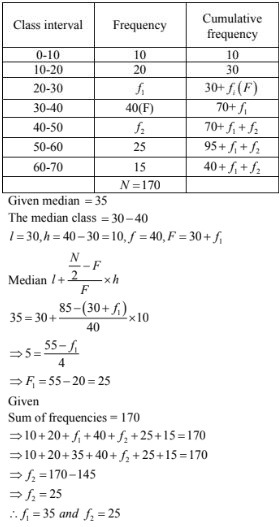
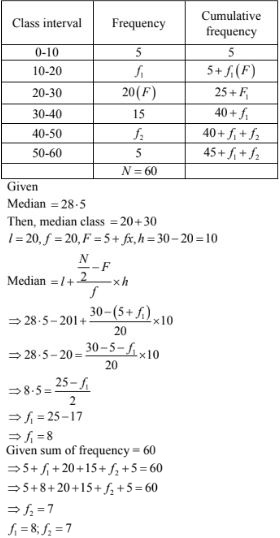
|
Class interval: |
0 – 10 |
10 – 20 |
20 – 30 |
30 – 40 |
40 – 50 |
50 – 60 |
Total |
|
Frequency: |
5 |
F1 |
20 |
15 |
F2 |
5 |
60 |
Solution
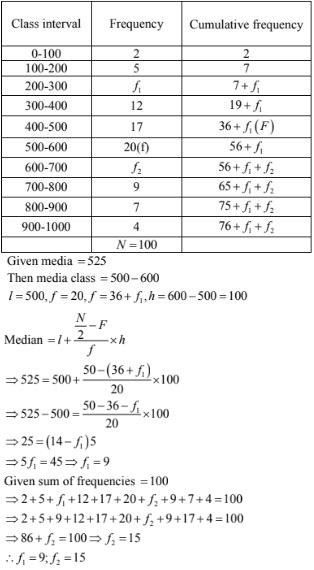
|
Class interval |
Frequency |
Class interval |
Frequency |
|
0 – 100 |
2 |
500 – 600 |
20 |
|
100 – 200 |
5 |
600 – 700 |
F2 |
|
200 – 300 |
F1 |
700 – 800 |
9 |
|
300 – 400 |
12 |
800 – 900 |
7 |
|
400 – 500 |
17 |
900 – 1000 |
4 |
Solution
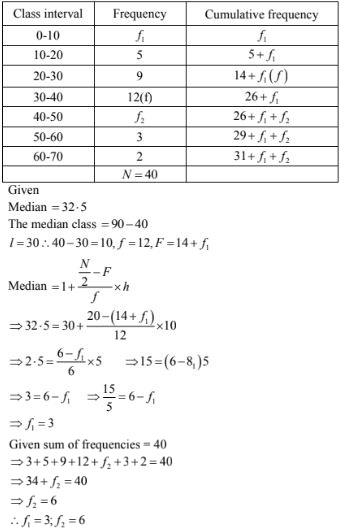
|
Class interval: |
0 – 10 |
10 – 20 |
20 – 30 |
30 – 40 |
40 – 50 |
50 – 60 |
60 – 70 |
Total |
|
Frequency: |
F1 |
5 |
9 |
12 |
F2 |
3 |
2 |
40 |
Solution
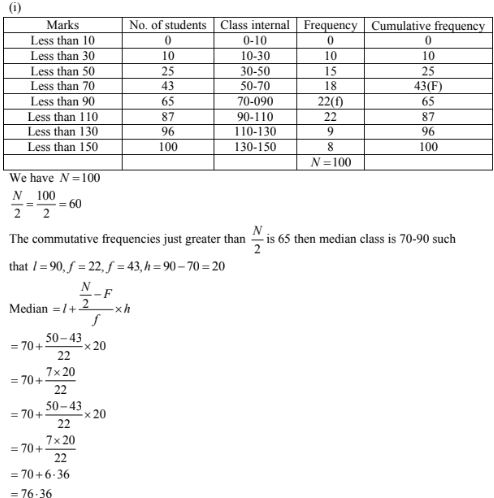
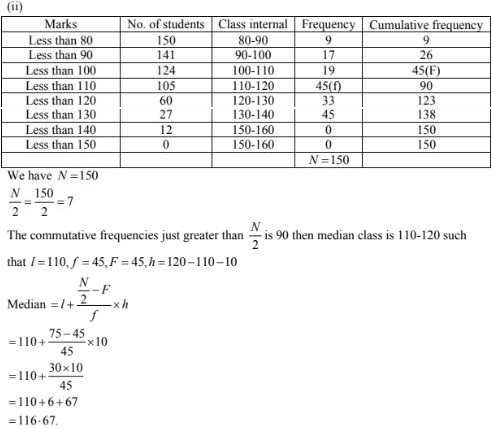
|
(i) Marks |
No. of students |
(ii) Marks |
No. of students |
|
Less than 10 |
0 |
More than 150 |
0 |
|
Less than 30 |
10 |
More than 140 |
12 |
|
Less than 50 |
25 |
More than 130 |
27 |
|
Less than 70 |
43 |
More than 120 |
60 |
|
Less than 90 |
65 |
More than 110 |
105 |
|
Less than 110 |
87 |
More than 100 |
124 |
|
Less than 130 |
96 |
More than 90 |
141 |
|
Less than 150 |
100 |
More than 80 |
150 |
Solution
|
Height in cm |
Number of Girls |
|
Less than 140 |
4 |
|
Less than 145 |
11 |
|
Less than 150 |
29 |
|
Less than 155 |
40 |
|
Less than 160 |
46 |
|
Less than 165 |
51 |
Find the median height.
Solution
To calculate the median height, we need to find the class intervals and their corresponding frequencies
The given distribution being of thee less than type 140, 145, 150, ........, 165 give the upper limits of corresponding class intervals. So, the classes should be below 140 , 145, 150, .....160, 165 observe that from the given distribution , we find that there are 4 - girls with height less than 140 is 4. Now there are 4 girls with heights less than 140. Therefore, the number of girls with height in the interval 140, 145 is 11 - 4 = 7, similarly. The frequencies of 145, 150 is 29 - 11 = 18, for 150 - 155 it is 40 -29 =11, and so on so our frequencies distribution becomes. 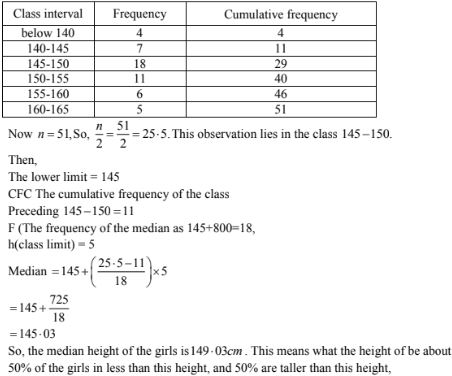
16. A life insurance agent found the following data for distribution of ages of 100 policy holders. Calculate the median age, if policies are only given to persons having age 18 years onwards but less than 60 years.
|
Age in years |
Number of policy holders |
|
Below 20 |
2 |
|
Below 25 |
6 |
|
Below 30 |
24 |
|
Below 35 |
45 |
|
Below 40 |
78 |
|
Bwlow 45 |
89 |
|
Below 50 |
90 |
|
Below 55 |
98 |
|
Below 60 |
100 |
Solution
Here class width is not same. There is no need to adjust the frequencies according to class intervals. Now given frequencies table is of less than type represented with upper class limits. As policies were given only to persons having age 18 years onwards but less than 60 years we can definite class intervals with their respective cumulative frequencies as below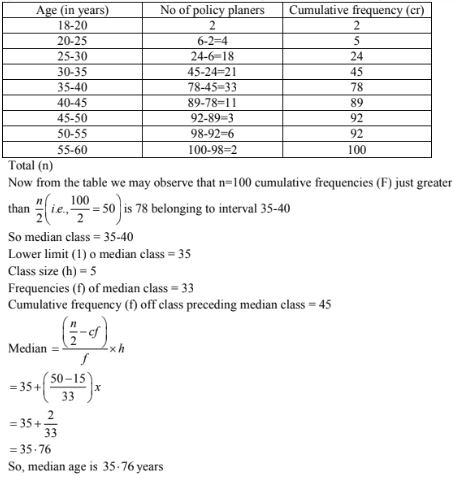
17. The lengths of 40 leaves of a plant are measured correct to the nearest millimeter, and the data obtained is represented in the following table:
|
Length( in mm): |
118 – 126 |
127 – 135 |
136 – 144 |
145 – 153 |
154 – 162 |
163 – 171 |
172 – 180 |
|
No.of leaves: |
3 |
5 |
9 |
12 |
5 |
4 |
2 |
Find the mean length of life.
Solution
The given data is not having continuous class intervals is 1. So, we have to add and subtract 1/2 = 0.5. upper class limits and lower class limits
Now continuous class intervals with respective cumulative frequencies can be presented as below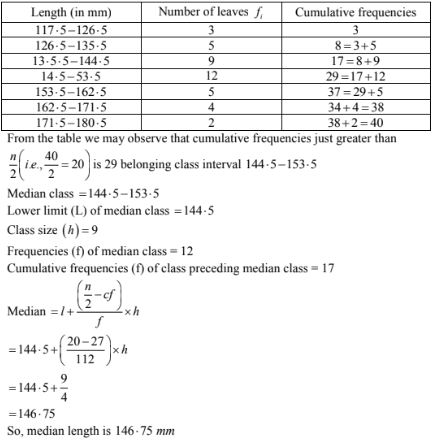
18. The following table gives the distribution of the life time fo 400 neon lamps:
|
Lite time(in hours) |
Number of lamps (1500 – 2000) 14 |
|
2000 – 2500 |
56 |
|
2500 – 3000 |
60 |
|
3000 – 3500 |
86 |
|
3500 – 4000 |
74 |
|
4000 – 4500 |
62 |
|
4500 – 5000 |
48 |
Find the median life.
Solution
We can find cumulative frequencies with their respective class intervals as below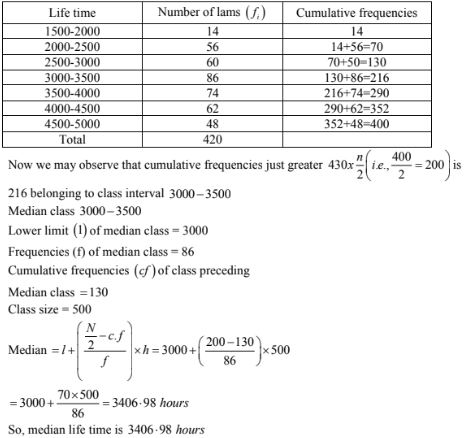
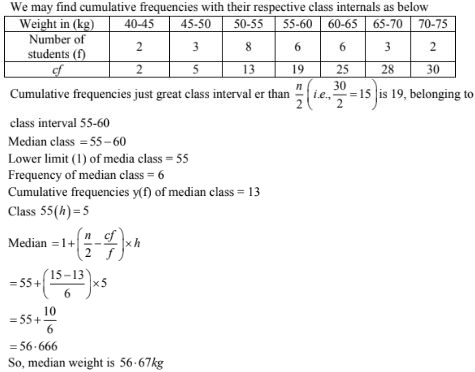
19. The distribution below gives the weight of 30 students in a class. Find the median weight f students:
|
Weight (in kg): |
40 – 45 |
45 – 50 |
50 – 55 |
55 – 60 |
60 – 65 |
65 – 70 |
70 – 75 |
|
No. of students |
2 |
3 |
8 |
6 |
6 |
3 |
2 |
Solution