RD Sharma Solutions Chapter 7 Statistics Exercise 7.3 Class 10 Maths

Chapter Name | RD Sharma Chapter 7 Statistics |
Book Name | RD Sharma Mathematics for Class 10 |
Other Exercises |
|
Related Study | NCERT Solutions for Class 10 Maths |
Exercise 7.3 Solutions
1. The following table gives the distribution of total household expenditure(in rupees) of manual workers in a city.
|
Expenditure (in rupees)(x) |
Frequency (fi) |
Expenditure (in rupees)(xi) |
Frequency(fi) |
|
100 – 150 |
24 |
300 – 350 |
30 |
|
150 – 200 |
40 |
350- 400 |
22 |
|
200 – 250 |
33 |
400 – 450 |
16 |
|
250 – 300 |
28 |
450 -500 |
7 |
Find the average expenditure (in rupees) per household.
Solution
Let the assumed mean (A) = 275.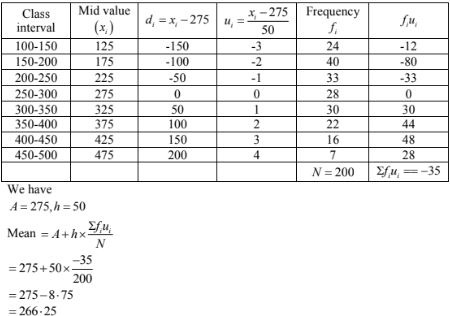
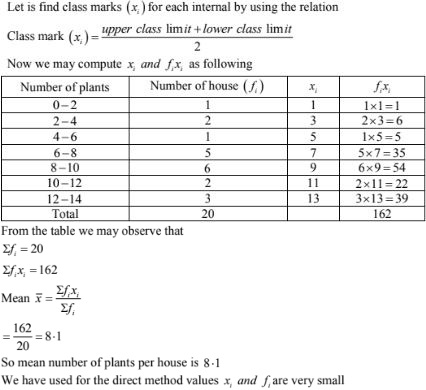
2. A survey was conducted by a group of students as a part of their environment awareness program, in which they collected the following data regarding the number of plants in 20 houses in a locality. Find the mean number of plants per house.
|
Number of plants: |
0 – 2 |
2 – 4 |
4 – 6 |
6 – 8 |
8 – 10 |
10 – 12 |
12 – 14 |
|
Number of houses : |
1 |
2 |
1 |
5 |
6 |
2 |
3 |
Which method did you use for finding the mean, and why ?
Solution
|
Daily wages(in Rs.) |
100 – 120 |
120 – 140 |
140 – 160 |
160 – 180 |
180 – 200 |
|
Number of workers : |
12 |
14 |
8 |
6 |
10 |
Find the mean dialy wages of the workers of the factory by using an appropriate method.
Solution
Let the assume mean (A) = 150 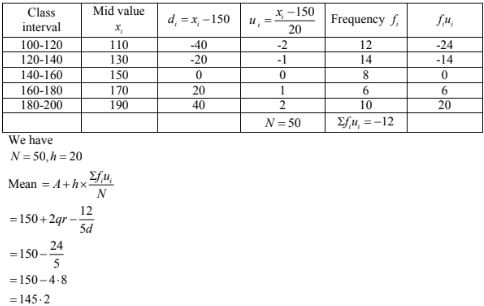
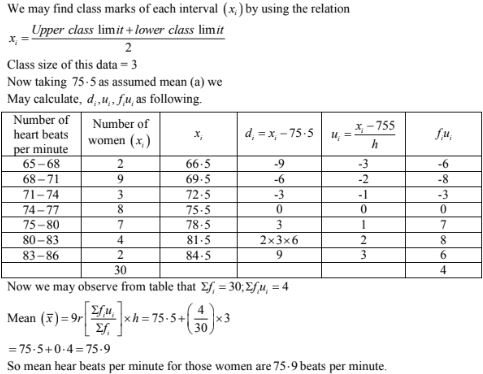
4. Thirty women were examined in a hospital by a doctor and the number of heart beats per minute recorded and summarized as follows. Find the mean heart beats per minute for these women, choosing a suitable method.
|
Number of heat |
65 – 68 |
68 – 71 |
71 – 74 |
74 – 77 |
77 – 80 |
80 – 83 |
83 – 86 |
|
Number of women: |
2 |
4 |
3 |
8 |
7 |
4 |
2 |
Solution
|
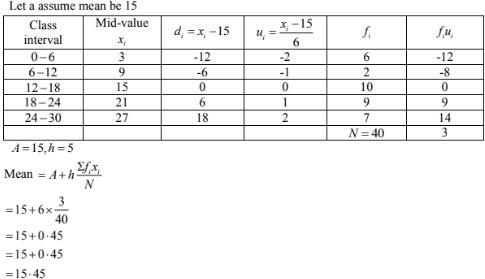
Class interval : |
0 – 6 |
6 – 12 |
12 – 18 |
18 – 24 |
24 – 30 |
|
Frequency: |
6 |
8 |
10 |
9 |
7 |
Solution
6.
|
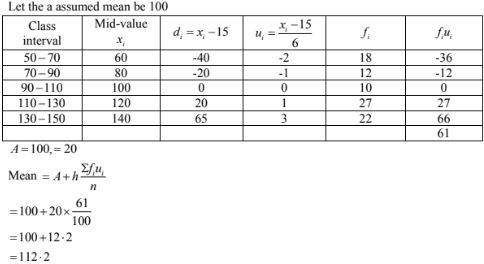
Class interval: |
50 – 70 |
70 – 90 |
90 – 110 |
110 – 130 |
130 – 150 |
150 – 170 |
|
Frequency: |
18 |
12 |
13 |
27 |
8 |
22 |
Solution
7.
|
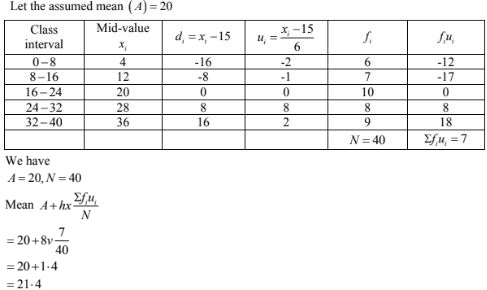
Class interval: |
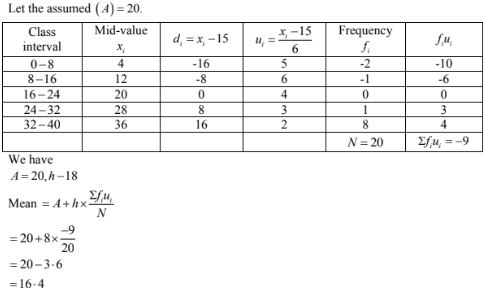
0 – 8 |
8 – 16 |
16 – 24 |
24 – 32 |
32 – 40 |
|
Frequency: |
6 |
7 |
10 |
8 |
9 |
Solution
8.
|
Class interval: |
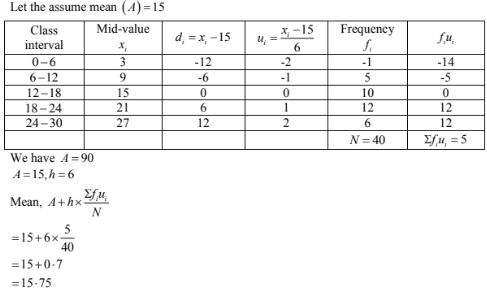
0 – 6 |
6 – 12 |
12 – 18 |
18 – 24 |
24 – 30 |
|
Frequency : |
7 |
5 |
10 |
12 |
6 |
Solution
9.
|
Class interval : |
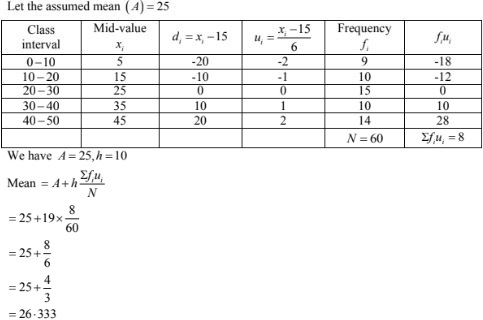
0 – 10 |
10 – 20 |
20 – 30 |
30 – 40 |
40 – 50 |
|
Frequency: |
9 |
12 |
15 |
10 |
14 |
Solution
10.
|
Class interval : |
0 – 8 |
8 – 16 |
16 – 24 |
24 – 32 |
32 – 40 |
|
Frequency: |
5 |
9 |
10 |
8 |
8 |
Solution

11.
|
Class interval: |
0 – 8 |
8 – 16 |
16 – 24 |
24 – 32 |
32 – 40 |
|
Frequency: |
5 |
6 |
4 |
3 |
2 |
Solution
12.
|
Class interval: |
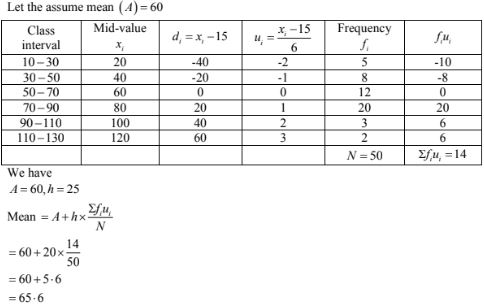
10 – 30 |
30 – 50 |
50 – 70 |
70 – 90 |
90 – 110 |
110 – 130 |
|
Frequency: |
5 |
8 |
12 |
20 |
3 |
2 |
Solution
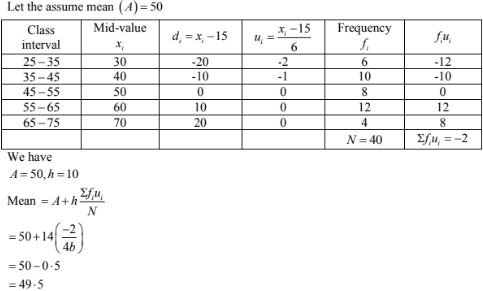
13.
|
Class interval: |
25 – 35 |
35 – 45 |
45 – 55 |
55 – 65 |
65 – 75 |
|
Frequency: |
6 |
10 |
8 |
12 |
4 |
Solution
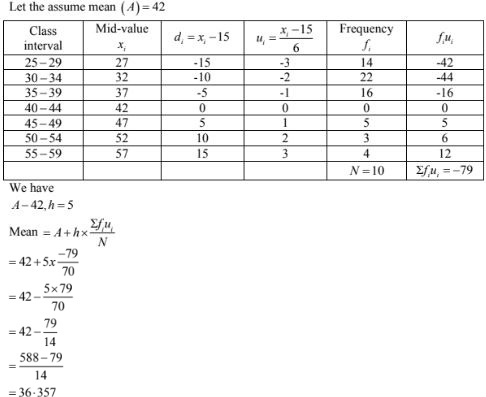
14.
|
Classes: |
25 – 29 |
30 – 34 |
35 – 39 |
40 – 44 |
45 – 49 |
50 – 54 |
55 – 59 |
|
Frequency: |
14 |
22 |
16 |
6 |
5 |
3 |
4 |
Solution
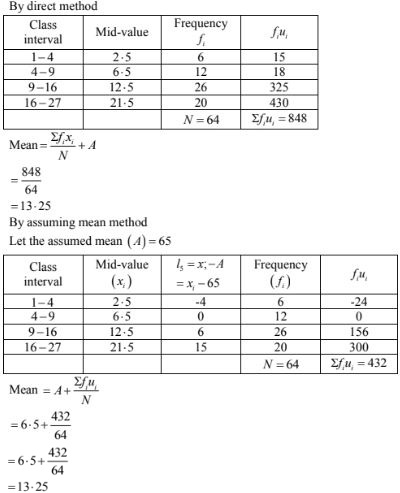
|
Size of item: |
1 -4 |
4 – 9 |
9 – 16 |
16 – 27 |
|
Frequency: |
6 |
12 |
26 |
20 |
Solution
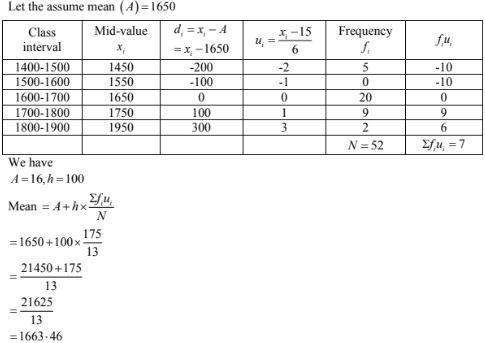
16. The weekly observations on cost of living index in a certain city for the year 2004 – 2005 are given below. Compute the weekly cost of living index.
|
Cost of living index |
Number of Students |
Cost of living index |
Number of Students |
|
1400 – 1500 |
5 |
1700 – 1800 |
9 |
|
1500 – 1600 |
10 |
1800 – 1900 |
6 |
|
1600 - 1700 |
20 |
1900 – 2000 |
2 |
Solution
|
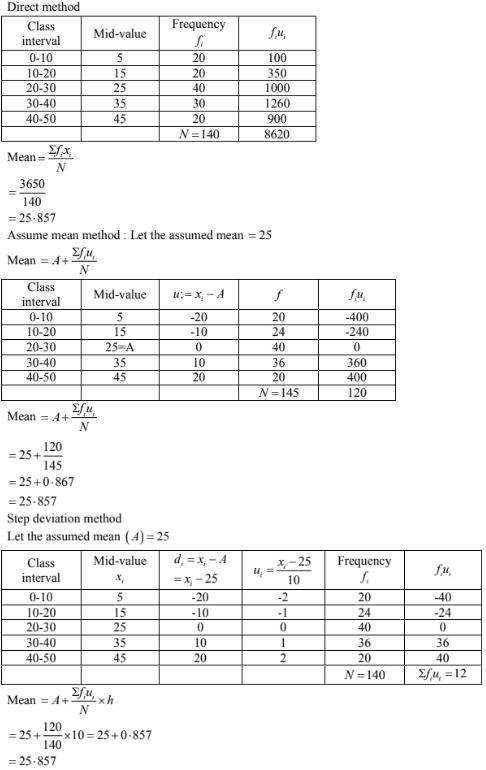
Marks: |
0 – 10 |
10 – 20 |
20 – 30 |
30 – 40 |
40 – 50 |
|
Number of students : |
20 |
24 |
40 |
36 |
20 |
Calculate the average marks by using all the three methods: direct method, assumed mean deviation and shortcut method.
Solution
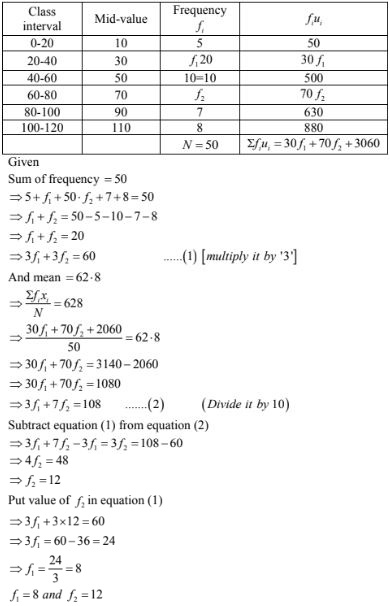
|
Class: |
0 – 20 |
20 – 40 |
40 – 60 |
60 – 80 |
80 – 100 |
100 – 120 |
|
Frequency: |
5 |
F1 |
10 |
F2 |
7 |
8 |
Solution
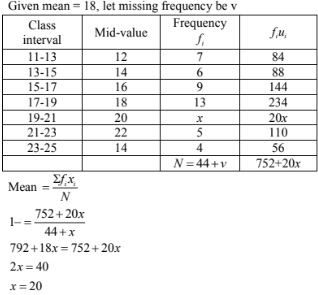
|
Class interval: |
11 – 13 |
13 – 15 |
15 – 17 |
17 – 19 |
19 – 21 |
21 – 23 |
23 – 25 |
|
Frequency: |
7 |
6 |
9 |
13 |
- |
5 |
4 |
Solution
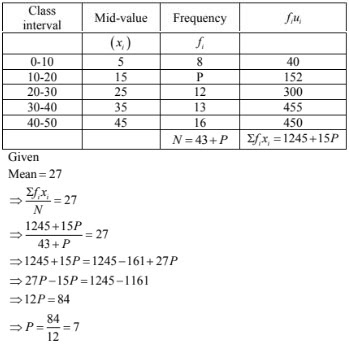
|
Class : |
0 – 10 |
10 – 20 |
20 – 30 |
30 – 40 |
40 – 50 |
|
Frequency: |
8 |
P |
12 |
13 |
10 |
Solution
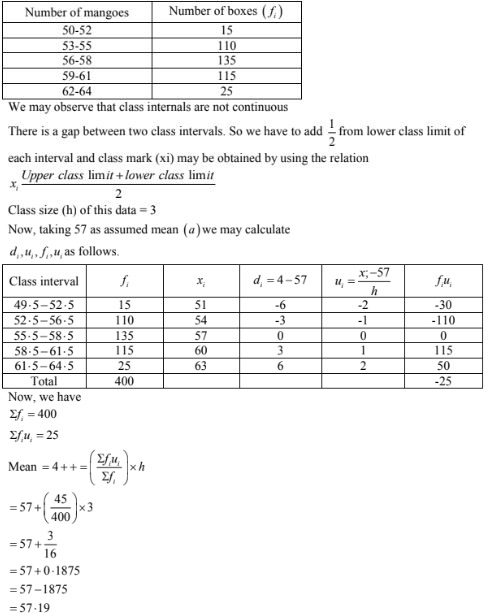
|
Number of mangoes: |
50 – 52 |
53 – 55 |
56 – 58 |
59 -61 |
62 -64 |
|
Number of boxes: |
15 |
110 |
135 |
115 |
25 |
Solution
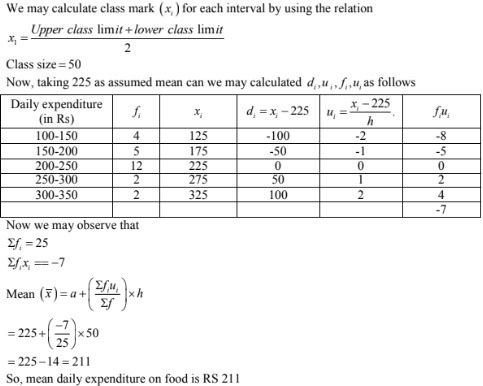
|
Daily expenditure(in Rs): |
100 – 150 |
150 – 200 |
200 – 250 |
250 – 300 |
300 – 350 |
|
Number of households: |
4 |
5 |
12 |
2 |
2 |
Find the mean daily expenditure on food by a suitable method.
Solution
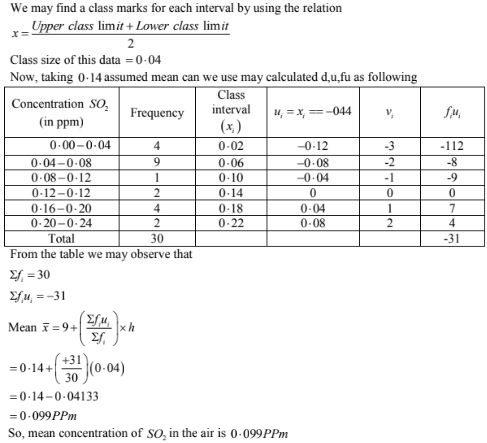
|
Concentration fo SO2 (in ppm) |
Frequency |
|
0.00 – 0.04 |
4 |
|
0.04 – 0.08 |
9 |
|
0.08 – 0.12 |
9 |
|
0.12 – 0.16 |
2 |
|
0.16 – 0.20 |
4 |
|
0.20 – 0.24 |
2 |
Find the mean concentration of SO2 in the air.
Solution
|
Number of days: |
0 – 6 |
6 – 10 |
10 – 14 |
14 – 20 |
20 – 28 |
28 – 38 |
38 – 40 |
|
Number of students: |
11 |
10 |
7 |
4 |
4 |
3 |
1 |
Solution
We may find class mark of each interval by using the relation 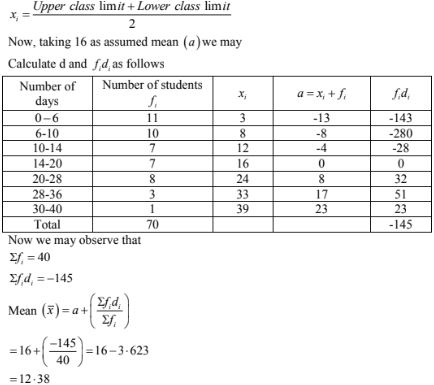
So, mean number of days is 12, 38 days for which student was absent.
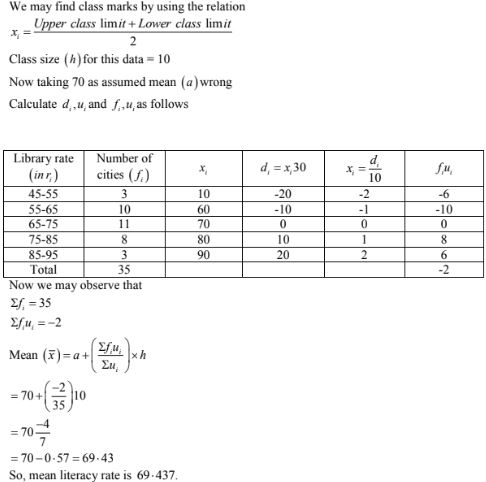
25. The following table gives the literacy rate(in percentage) of 35 cities. Find the mean literacy rate.
|
Literacy rate(in %): |
45 – 55 |
55 – 65 |
65 – 75 |
75 – 85 |
85 – 95 |
|
Number of cities: |
3 |
10 |
11 |
8 |
3 |
Solution