RD Sharma Solutions Chapter 7 Statistics Exercise 7.6 Class 10 Maths

Chapter Name | RD Sharma Chapter 7 Statistics |
Book Name | RD Sharma Mathematics for Class 10 |
Other Exercises |
|
Related Study | NCERT Solutions for Class 10 Maths |
Exercise 7.6 Solutions
1. Draw an given by less than method for the following data:
|
No. of rooms: |
1 |
2 |
3 |
4 |
5 |
6 |
7 |
8 |
9 |
10 |
|
No. of houses: |
4 |
9 |
22 |
28 |
24 |
12 |
8 |
6 |
5 |
2 |
Solution
We first prepare the cumulative frequency distribution table by less than method as given be :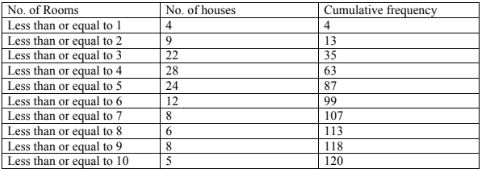
Now, we mark the upper class limits along x - axis and cumulative frequency along y - axis.
Thus we plot the point (1,4), (2, 3), (3, 35), (4, 63), (5, 87), (6, 99), (7,107), (8, 113), (9, 118), (10, 120).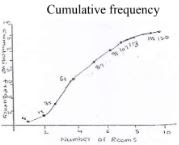
2. The marks scored by 750 students in an examination are given in the form of a frequency distribution table:
|
Marks |
No. of students |
Marks |
No. of students |
|
600 – 640 |
16 |
760 – 800 |
172 |
|
640 – 680 |
45 |
800 – 840 |
59 |
|
680 – 720 |
156 |
840 – 800 |
18 |
|
720 – 760 |
284 |
Prepare a cumulative frequency table by less than method and draw an ogive.
Solution
We first prepare the cumulative frequency table by less than method as given below :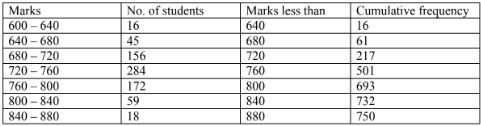
Now, we mark the upper class limits along x-axis and cumulative frequency along y-axis on a suitable gear.
Thus, we plot the points (640, 16) (680, 61), (720, 217), (760, 501), (600, 673), (840, 732) and (880, 750).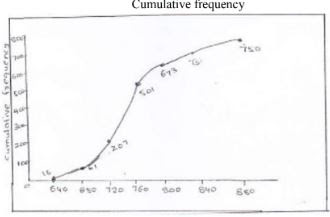
3. Draw an ogive to represent the following frequency distribution:
|
Class – interval : |
0 – 4 |
5 – 9 |
10 – 14 |
15 – 19 |
20 – 24 |
|
No. of students: |
2 |
6 |
12 |
5 |
3 |
Solution
The given frequency of distribution is not continuous so we first make it continuous and prepare the cumulative frequency distribution as under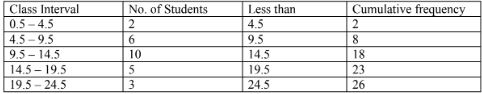
Now, we mark the upper class limits along x-axis and cumulative frequency along y-axis.
Thus we plot the points (4, 5, 2), (9, 5, 8), (14, 5, 08), (19, 5, 23) and (24, 5, 26)
Cumulative frequency.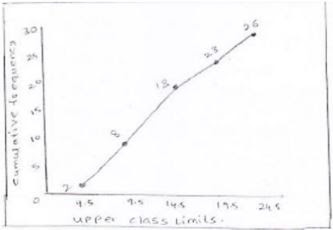
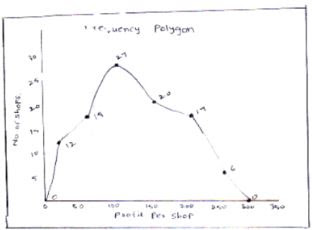
4. The monthly profits (in Rs.) of 100 shops are distributed as follows:
|
Profits per shop: |
0 – 50 |
50 – 100 |
100 – 150 |
150 – 200 |
200 – 250 |
250 – 300 |
|
No. of shops: |
12 |
18 |
27 |
20 |
17 |
6 |
Draw the frequency polygon for it.
Solution
We have, 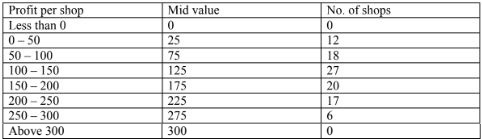
5. The following table gives the height of trees:
|
Height |
No. of trees |
|
Less than 7 |
26 |
|
Less than 14 |
57 |
|
Less than 21 |
92 |
|
Less than 28 |
134 |
|
Less than 35 |
216 |
|
Less than 42 |
287 |
|
Less than 49 |
341 |
|
Less than 56 |
360 |
Draw ‘less than’ ogive and ‘more than’ ogive.
Solution
Less than method,
It is given that, 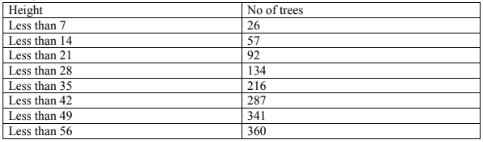
Now, we mark the upper class limits along x - axis and cumulative frequency along y - axis.
Thus we plot the points (7, 26) (14, 57) (21, 92) (28, 134) (35, 216) (42, 287) (49, 341) (56, 360)
More than method: we prepare the cf table by more than method as given below: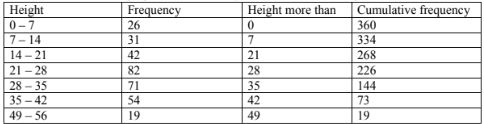
Now, we mark on x - axis lower class limits, y - axis cumulative frequency
Thus, we plot graph at(0,360)(7, 334)(14,303)(21, 268)(28,226)(35,144)(42, 73)(49, 19)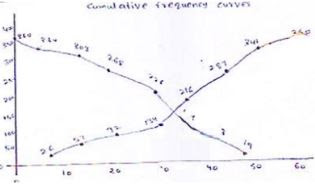
|
Profit (in lakhs in Rs) |
Number of shops(frequency) |
|
More than or equal to 5 |
30 |
|
More than or equal to 10 |
28 |
|
More than or equal to 15 |
16 |
|
More than or equal to 20 |
14 |
|
More than or equal to 25 |
10 |
|
More than or equal to 30 |
7 |
|
More than or equal to 35 |
3 |
Draw both ogives for the above data and hence obtain the median.
Solution
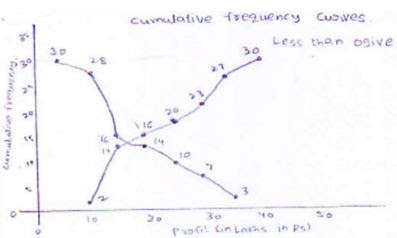
More than method 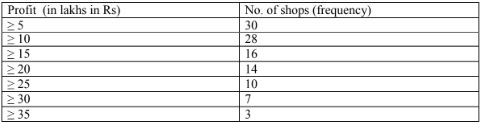
Now, we mark on x - axis lower class limits, y - axis cumulative frequency
Thus, we plot the points. (5, 30)(10, 28)(15, 16)(20, 14)(25, 10)(30, 7) and (35, 3)
Less than method.
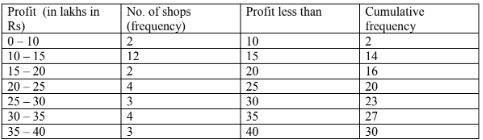
Now, we mark the upper class limits along x - axis and cumulative frequency along y - axis.
Thus we plot the points, (10, 2) (15, 14)(20, 16)(25, 20)(30, 23)(35, 27)(40, 30)
We find that the two types of curves intersect of point P from point L it is drawn on x - axis.
The value of a profit corresponding to M is 17.5 lakh, Hence median is 17.5 lakh
|
Daily income (in Rs): |
100 – 120 |
120 – 140 |
140 – 160 |
160 – 180 |
180 – 200 |
|
Number of workers: |
12 |
14 |
8 |
6 |
10 |
Convert the above distribution to a less than type cumula five frequency distribution and draw its ogive.
Solution
We first prepare the cumulative frequency table by less than method as given below.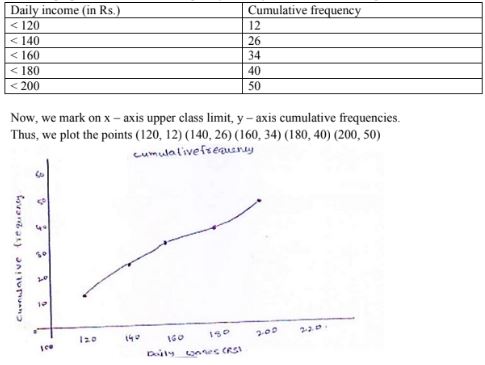
8. The following table gives production yield per hectare of wheat of 100 farms of a village:
|
Production yield in kg per hectare: |
50 – 55 |
55 – 60 |
60 – 65 |
65 – 70 |
70 – 75 |
75 – 80 |
|
Number of farms: |
2 |
8 |
12 |
24 |
38 |
16 |
Draw ‘less than’ ogive and ‘more than’ ogive.
Solution
Less than method:
Cumulative frequency table by less than method. 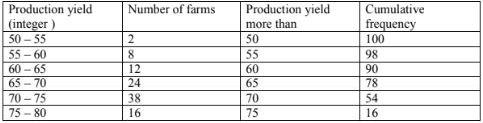
Now, we mark on x - axis upper class limit, y - axis cumulative frequencies.
We plot the points(50, 100)(55, 98)(60, 90)(65, 78)(70, 54)(75, 16)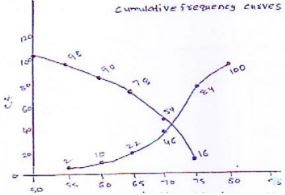
9. During the medical check – up of 35 students of a class, their weights were recorded as follows:
|
Weight (in kg) |
No. of students |
|
Less than 38 |
0 |
|
Less than 40 |
3 |
|
Less than 42 |
5 |
|
Less than 44 |
9 |
|
Less than 46 |
14 |
|
Less than 48 |
28 |
|
Less than 50 |
32 |
|
Less than 52 |
35 |
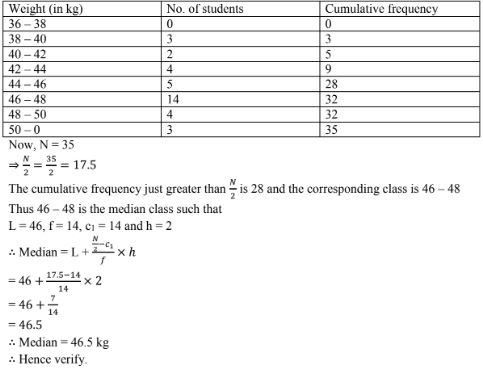
Draw a less than type ogive for the given data. Hence, obtain the median weight from the graph and verify the result by using the formula.
Solution
Less than method
It is given that
On x - axis upper class limits. Y - axis cf.
We plot the points (38, 0)(40, 3)(42, 5)(44, 9)(46, 4)(48, 28)(50, 32)(52, 35)
More than method: Cf table 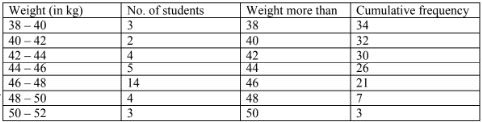
x - axis lower class limits on y - axis - cf
We plot the points(38, 35)(40, 32)(42, 30)(44, 26)(46, 21)(48, 7)(50, 3)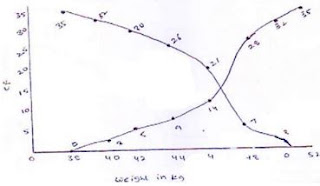
The verification,
We have