RS Aggarwal Solutions Chapter 9 Mean, Mode and Median Exercise 9E Class 10 Maths

Chapter Name | RS Aggarwal Chapter 9 Mean, Mode and Median |
Book Name | RS Aggarwal Mathematics for Class 10 |
Other Exercises |
|
Related Study | NCERT Solutions for Class 10 Maths |
Exercise 9E Solutions
1. Find the median of the following data by making a ‘less than ogive’.
|
Marks |
0 - 10 |
10 - 20 |
20 - 30 |
40 - 50 |
50 - 60 |
60 - 70 |
70 - 80 |
80 - 90 |
90 -100 |
|
Number of students |
5 |
3 |
4 |
3 |
3 |
4 |
7 |
9 |
8 |
Solution
The frequency distribution table of less than type is given as follows:

|
Marks (upper class limits) |
Cumulative Frequency (cf) |
|
Less than 10 |
5 |
|
Less than 20 |
5 + 3 = 8 |
|
Less than 30 |
8 + 4 = 12 |
|
Less than 40 |
12 + 3 = 15 |
|
Less than 50 |
15 + 3 = 18 |
|
Less than 60 |
18 + 4 = 22 |
|
Less than 70 |
22 + 7 = 29 |
|
Less than 80 |
29 + 9 = 38 |
|
Less than 90 |
38 + 7 = 45 |
|
Less than 100 |
45 + 8 = 53 |
Taking upper class limits of class intervals on x-axis and their respective frequencies on y-axis, its ogive can be drawn as follows:
Here, N = 53 ⇒ N/2 = 26.5
Mark the point A whose ordinate is 26.5 and its x-coordinate is 66.4.

Thus, median of the data is 66.4.
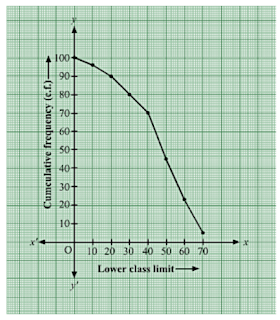
2. The given distribution shows the number of wickets taken by the bowlers in one-day international cricket matches:
|
Number of wickets |
Less than 15 |
Less than 30 |
Less than 45 |
Less than 60 |
Less than 75 |
Less than 90 |
Less than 105 |
Less than 120 |
|
Number of bowlers |
2 |
5 |
9 |
17 |
39 |
54 |
70 |
80 |
|
|
Solution
Taking upper class limits of class intervals on x-axis and their respective frequencies on y-axis, its ogive can be drawn as follows:

Here, N = 80 ⇒ N/2 = 40.
Mark the point a whose ordinate is 40 and its x-coordinate is 76.

Thus, median of the data is 76.
3. Draw a ‘more than’ ogive for the data given below which gives the marks of 100 students.
|
Marks |
0 - 10 |
10 - 20 |
20 - 30 |
30 - 40 |
40 - 50 |
50 - 60 |
60 - 70 |
70 - 80 |
|
No. of students |
4 |
6 |
10 |
10 |
25 |
22 |
18 |
5 |
Solution
The frequency distribution table of more than type is as follows:
|
Marks (upper class limits) |
Cumulative frequency (cf) |
|
More than 0 |
96 + 4 = 100 |
|
More than 10 |
90 + 6 = 96 |
|
More than 20 |
80 + 10 = 90 |
|
More than 30 |
70 + 10 = 80 |
|
More than 40 |
45 + 25 = 70 |
|
More than 50 |
23 + 22 = 45 |
|
More than 60 |
18 + 5 = 23 |
|
More than 70 |
5 |
Taking lower class limits of on x-axis and their respective cumulative frequencies on y-axis, its ogive can be drawn as follows:
|
Height (in cm) |
135 - 140 |
140 - 145 |
145 - 150 |
150 - 155 |
155 - 160 |
160 - 165 |
|
No. of students |
5 |
8 |
9 |
12 |
14 |
2 |
Draw a ‘more than type’ ogive for the above data.
Solution
The frequency distribution table of more than type is as follows:
|
Height (in cm) (lower class limit) |
Cumulative frequency (cf) |
|
More than 135 |
5 + 45 = 50 |
|
More than 140 |
8 + 37 = 45 |
|
More than 145 |
9 + 28 = 37 |
|
More than 150 |
12 + 16 = 28 |
|
More than 155 |
14 + 2 = 16 |
|
More than 160 |
2 |

|
Monthly Consumption (in units) |
140 - 160 |
160 - 180 |
180 - 200 |
200 - 220 |
220 - 240 |
240 - 260 |
260 - 280 |
|
Number of Families |
3 |
8 |
15 |
40 |
50 |
30 |
10 |
Prepare a ‘more than type’ ogive for the given frequency distribution.
Solution
The frequency distribution table of more than type is as follows:
|
Height (in cm) (lower class limit) |
Cumulative frequency (cf) |
|
More than 140 |
3 + 153 = 156 |
|
More than 160 |
8 + 145 = 153 |
|
More than 180 |
15 + 130 = 145 |
|
More than 200 |
40 + 90 = 130 |
|
More than 220 |
50 + 40 = 90 |
|
More than 240 |
30 + 10 = 40 |
|
More than 260 |
10 |
Taking the lower class limits of an x-axis and their respective cumulative frequencies on y-axis, its ogive can be drawn as follows:

|
Production Yield (kg/ha) |
50 - 55 |
55 - 60 |
60 - 65 |
65 - 70 |
70 - 75 |
75 - 80 |
|
Number of farms |
2 |
8 |
12 |
24 |
238 |
16 |
Change the distribution to a ‘more than type’ distribution and draw its ogive. Using ogive, find the median of the given data.
Solution
The frequency distribution table of more than type is as follows:
|
Production yield (kg/ha) (lower class limits) |
Cumulative frequency (cf) |
|
More than 50 |
2 + 98 = 100 |
|
More than 55 |
8 + 90 = 98 |
|
More than 60 |
12 + 78 = 90 |
|
More than 65 |
24 + 54 = 78 |
|
More than 70 |
38 + 16 = 54 |
|
More than 75 |
16 |
Taking the lower class limits on x-axis and their respective cumulative on y-axis, its ogive can be drawn as follows:

Here, N = 100
⇒ N/2 = 50.
Mark the point A whose ordinate is 50 and its x-coordinate is 70.5.

Thus, median of the data is 70.5.
7. The table given below shows the weekly expenditures on food of some households in a locality.
|
Weekly expenditure (in ₹) |
No. of house holds |
|
100 - 200 |
5 |
|
200 - 300 |
6 |
|
300 - 400 |
11 |
|
400 - 500 |
13 |
|
500 - 600 |
5 |
|
600 - 700 |
4 |
|
700 - 800 |
3 |
|
800 - 900 |
1 |
Draw a ‘less than type ogive’ and a ‘more than type ogive’ for this distribution.
Solution
The frequency distribution table of less than type is as follows:
|
Weekly expenditure (in ₹) (upper class limits) |
Cumulative frequency (cf) |
|
Less than 200 |
5 |
|
Less than 300 |
5 + 6 = 11 |
|
Less than 400 |
11 + 11 = 22 |
|
Less than 500 |
22 + 13 = 35 |
|
Less than 600 |
35 + 5 = 40 |
|
Less than 700 |
40 + 4 = 44 |
|
Less than 800 |
44 + 3 = 47 |
|
Less than 900 |
47 + 2 = 49 |
Taking the lower class limits on x-axis and their respective cumulative frequencies on y-axis, its ogive can be obtained as follows:

Now, the frequency distribution table of more than type is as follows:
|
Weekly expenditure (in ₹) (lower class limits) |
Cumulative frequency (cf) |
|
More than 100 |
44 + 5 = 49 |
|
More than 200 |
38 + 6 = 44 |
|
More than 300 |
27 + 11 = 38 |
|
More than 400 |
14 + 13 = 27 |
|
More than 500 |
9 + 5 = 14 |
|
More than 600 |
5 + 4 = 9 |
|
More than 700 |
2 + 3 = 5 |
|
More than 800 |
2 |
Taking the lower class limits on x-axis and their respective cumulative frequencies on y-axis, its ogive can be obtained as follows:

8. From the following frequency, prepare the ‘more than’ ogive.
|
Score |
Number of candidates |
|
400 - 450 |
20 |
|
450 - 500 |
35 |
|
500 - 550 |
40 |
|
550 - 600 |
32 |
|
600 - 650 |
24 |
|
650 – 700 |
27 |
|
700 – 750 |
18 |
|
750 – 800 |
34 |
|
Total |
230 |
Also, find the median.
Solution
From the given table, we may prepare than ‘more than’ frequency table as shown below:
|
Score |
Number of candidates |
|
More than 750 |
34 |
|
More than 700 |
52 |
|
More than 650 |
79 |
|
More than 600 |
103 |
|
More than 550 |
135 |
|
More than 500 |
175 |
|
More than 450 |
210 |
|
More than 400 |
230 |
We plot the points A(750, 34), B(700, 52), C(650, 79), D(600, 103), E(550, 135), F(500, 175), G(450, 210) and H(400, 230).
Join AB, BC, CD, DE, EF, FG, GH and HA with a free hand to get the curve representing the ‘more than type’ series.

Here, N = 230
⇒ N/2 = 115
From P(0, 115), draw PQ meeting the curve at Q. Draw QM meeting at M.
Clearly, OM = 590 units
Hence, median = 590 units.
9. The marks obtained by 100 students of a class in an examination are given below:
|
Marks |
Number of students |
|
0 - 5 |
2 |
|
5 - 10 |
5 |
|
10 – 15 |
6 |
|
15 – 20 |
8 |
|
20 - 25 |
10 |
|
25 – 30 |
25 |
|
30 - 35 |
20 |
|
35 - 40 |
18 |
|
40 – 45 |
4 |
|
45 - 50 |
2 |
Draw cumulative frequency curves by using (i) ‘less than’ series and (ii) ‘more than’ series. Hence, find the median.
Solution
(i) From the given table, we may prepare the ‘less than’ frequency table as shown below:
|
Marks |
Number of students |
|
Less than 5 |
2 |
|
Less than 10 |
7 |
|
Less than 15 |
13 |
|
Less than 20 |
21 |
|
Less than 25 |
31 |
|
Less than 30 |
56 |
|
Less than 35 |
76 |
|
Less than 40 |
94 |
|
Less than 45 |
98 |
|
Less than 50 |
100 |
We plot the points A(5, 2), B(10, 7), C(15, 13), D(20, 21), E(25, 31), F(30, 56), G(35, 76) and H(40, 94), I(45, 98) and j(50, 100).
Join AB, BC, CD, DE, EF, FG, GH, HI, IJ and JA with a free hand to get the curve representing the ‘less than type’ series.
(ii) More than series:
|
Marks |
Number of students |
|
More than 0 |
100 |
|
More than 5 |
98 |
|
More than 10 |
93 |
|
More than 15 |
87 |
|
More than 20 |
79 |
|
More than 25 |
69 |
|
More than 30 |
44 |
|
More than 35 |
24 |
|
More than 40 |
6 |
|
More than 45 |
2 |
Now, on the same graph paper, we plot the points (0, 100), (5, 98), (10, 94), (15, 76),, (20, 56), (25, 31), (30, 21), (35, 13), (40, 6) and (45, 2).
Join with a free hand to get the ‘more than type’ series.

The two curves intersect at point. Draw LM ⊥ OX cutting the x-axis at M.
Clearly, M = 29.5
Hence, Median = 29.5
10. From the following data, draw the two types of cumulative frequency curves and determine the median:
|
Marks |
Frequency |
|
140 - 144 |
3 |
|
144 - 148 |
9 |
|
148 - 152 |
24 |
|
152 - 156 |
31 |
|
156 - 160 |
42 |
|
160 - 164 |
64 |
|
164 – 168 |
75 |
|
168 – 172 |
82 |
|
172 – 176 |
86 |
|
176 - 180 |
34 |
Solution
(i) Less than series:
|
Marks |
No. of students |
|
Less than 144 |
3 |
|
Less than 148 |
12 |
|
Less than 152 |
36 |
|
Less than 156 |
67 |
|
Less than 160 |
109 |
|
Less than 164 |
173 |
|
Less than 168 |
248 |
|
Less than 172 |
230 |
|
Less than 176 |
416 |
|
Less than 180 |
450 |
We plot the points A(144, 3), B(148, 12), C(152, 36), D(156, 67), E(160, 109), F(164, 173), G(168, 248) and H(172, 330), I(176, 416) and J(180, 450).
Join AB, BC, CD, DE, EF, FG, GH, HI, IJ and JA with a free hand to get the curve representing the ‘less than type’ series.
(ii) More than series:
|
Marks |
Number of students |
|
More than 140 |
450 |
|
More than 144 |
447 |
|
More Than 148 |
438 |
|
More than 152 |
414 |
|
More than 156 |
383 |
|
More than 160 |
341 |
|
More than 164 |
277 |
|
More than 168 |
202 |
|
More than 172 |
120 |
|
More than 176 |
34 |
Now, on the same graph paper, we plot the points A1 (140, 150), B1(144, 447), C1(148, 438), D1(152, 414), E1(156, 383), F1(160, 277), H1(168, 202), I1(172, 120) and J1 (176, 34),
Join A1B1, B1C1, C1D1, D1E1, E1F1, F1G1, G1H1, H1I1 and I1J1 with a free hand to get the ‘more than type’ series.

The two curves intersect at point L. Draw LM ⊥ OX cutting the x-axis at M. Clearly M = 166 cm
Hence, median = 166 cm