Chapter 24 Measures of Central Tendency RD Sharma Solutions Exercise 24.2 Class 9 Maths

Chapter Name | RD Sharma Chapter 24 Measures of Central Tendency Exercise 24.2 |
Book Name | RD Sharma Mathematics for Class 10 |
Other Exercises |
|
Related Study | NCERT Solutions for Class 10 Maths |
Exercise 24.2 Solutions
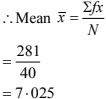
1. Calculate the mean for the following distribution :
|
X |
5 |
6 |
7 |
8 |
9 |
|
F |
4 |
8 |
14 |
11 |
3 |
Solution
|
X |
F |
Fx |
|
5 |
4 |
20 |
|
6 |
8 |
48 |
|
7 |
14 |
98 |
|
8 |
11 |
88 |
|
9 |
3 |
27 |
|
|
N = 40 |
Σfx = 281 |
2. Find the mean of the following data:
|
X |
19 |
21 |
23 |
25 |
27 |
29 |
31 |
|
F |
13 |
15 |
16 |
18 |
16 |
15 |
13 |
Solution
|
X |
F |
Fx |
|
19 |
13 |
247 |
|
21 |
15 |
315 |
|
23 |
16 |
368 |
|
25 |
18 |
450 |
|
27 |
16 |
432 |
|
29 |
15 |
435 |
|
31 |
13 |
403 |
|
|
N = 106 |
Σfx = 2650 |
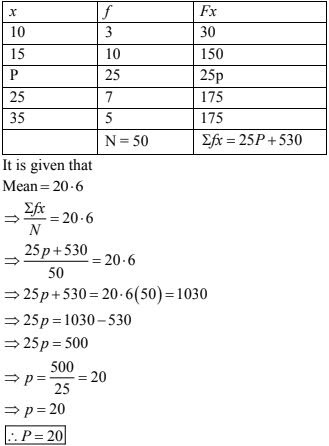
3. The mean of the following data is 20.6. Find the value of P.
|
x |
10 |
15 |
P |
25 |
35 |
|
F |
3 |
10 |
25 |
7 |
5 |
Solution
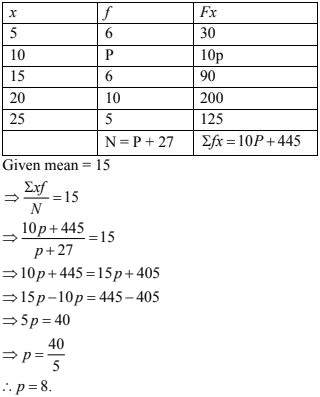
4. If the mean of the following data is 15, find P.
|
x |
5 |
10 |
15 |
20 |
25 |
|
F |
6 |
P |
6 |
10 |
5 |
Solution
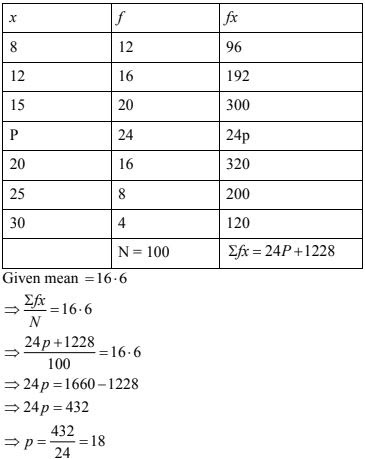
5. Find the value of p for the following distribution whose mean is 16.6
|
x |
8 |
12 |
15 |
P |
20 |
25 |
30 |
|
f |
12 |
16 |
20 |
24 |
16 |
8 |
4 |
Solution
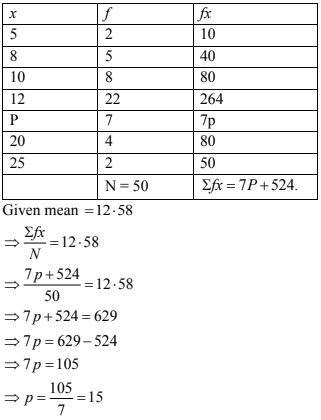
6. Find the missing value of p for the following distribution whose mean is 12.58.
|
X |
5 |
8 |
10 |
12 |
P |
20 |
25 |
|
F |
2 |
5 |
8 |
22 |
7 |
4 |
2 |
Solution
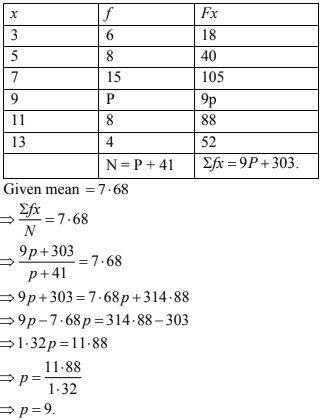
7. Find the missing frequency (p) for the following distribution whose mean is 7.68.
|
X |
3 |
5 |
7 |
9 |
11 |
13 |
|
F |
6 |
8 |
15 |
P |
8 |
4 |
Solution
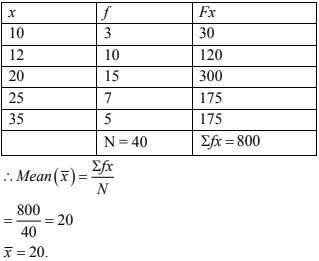
8. Find the mean of the following distribution :
|
X |
10 |
12 |
20 |
25 |
35 |
|
F |
3 |
10 |
15 |
7 |
5 |
Solution
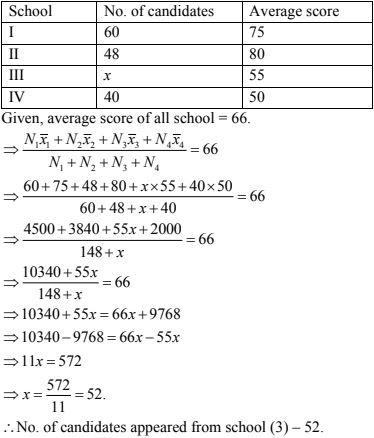
9. Candidates of four schools appear in a mathematics test. The data were as follows:
|
Schools |
No. of candidates |
Average score |
|
I |
60 |
75 |
|
II |
48 |
80 |
|
III |
NA |
55 |
|
IV |
40 |
50 |
If the average score of the candidates of all the four schools is 66, find the number of
candidates that appeared from school III.
Solution
Let no. of candidates appeared from school III = x.
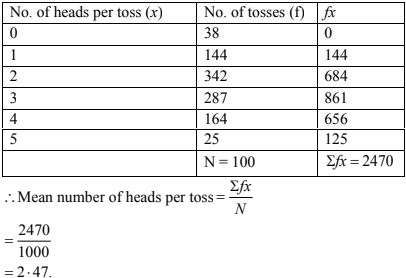
10. Five coins were simultaneously tossed 1000 times and at each toss the number of heads were
observed. The number of tosses during which 0, 1, 2, 3, 4 and 5 heads were obtained are shown in the table below. Find the mean number of heads per toss.
|
No. of heads per toss |
No. of tosses |
|
0 |
38 |
|
1 |
144 |
|
2 |
342 |
|
3 |
287 |
|
4 |
164 |
|
5 |
25 |
|
Total |
1000 |
Solution
11. Find the missing frequencies in the following frequency distribution if its known that the mean of the distribution is 50.
|
X |
10 |
30 |
50 |
70 |
90 |
|
|
F |
17 |
F1 |
32 |
F2 |
19 |
Total = 120 |
Solution
