Chapter 23 Graphical Representation of Statistical Data RD Sharma Solutions Exercise 23.2 Class 9 Maths

Chapter Name | RD Sharma Chapter 23 Tabular Representation of Statistical Data Exercise 23.2 |
Book Name | RD Sharma Mathematics for Class 10 |
Other Exercises |
|
Related Study | NCERT Solutions for Class 10 Maths |
Exercise 23.2 Solutions
1. Explain the reading and interpretation of bar graphs.
Solution
First step in reading a bar graph is to know what it represents or what is the information given by it, for this we read the captions. Which are generally written just below the horizontal line (x - axis) and adjacent to vertical line (y - axis)
After knowing that what a bar graph represents, we read the scale so that we can know the precise value in the given data.
After reading a bar graph one must be able to draw certain condusions from it. Drawing some conditions from a given bar graph means interpretation of the bar graph.
2. Read the following bar graph and answer the following questions:
(i) What information is given by the bar graph?
(ii) In which year the export is minimum?
(iii)In which year the import is maximum?
(iv)In which year the difference of the values of export and import is maximum?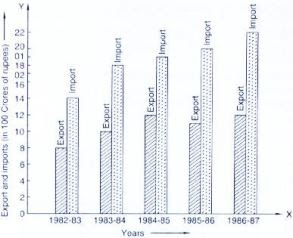
Solution
(i) It gives the information regarding import and export from 1982 - 83 t 1986 - 87
(ii) The export is minimum in the years 1982 - 83
(iii) The imports is maximum in 1986 - 87.
(iv) The different of value of export and import is maximum in 1986 - 87
3. The following bar graph shows the results of an annual examination in a secondary school. Read the bar graph (Fig. 23.28) and choose the correct alternative in each of the following: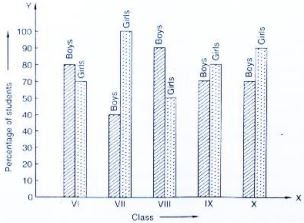
(i) The pair of classes in which the results of boys and girls are inversely proportional are:
(a) VI, VIII
(b) VI, IX
(c) VIII, IX
(d) VIII, X
(ii) The class having the lowest failure rate of girls is
(a) VII
(b) X
(c) IX
(d) VIII
(iii)The class having the lowest pass rate of students is
(a) VI
(b) VII
(c) VIII
(d) IX
Solution
(i) (b) VI, IX
(ii) (a) VII
(iii) (b) VII