RD Sharma Solutions Chapter 7 Statistics Exercise 7.1 Class 10 Maths

Chapter Name | RD Sharma Chapter 7 Statistics |
Book Name | RD Sharma Mathematics for Class 10 |
Other Exercises |
|
Related Study | NCERT Solutions for Class 10 Maths |
Exercise 7.1 Solutions
|
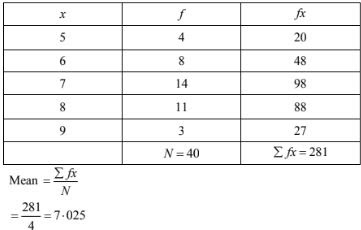
x : |
5 |
6 |
7 |
8 |
9 |
|
f : |
4 |
8 |
14 |
11 |
3 |
Solution
|
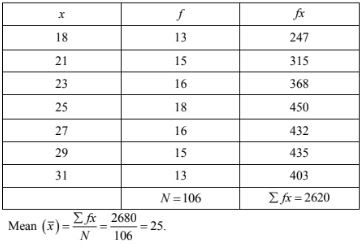
x : |
19 |
21 |
23 |
25 |
27 |
29 |
31 |
|
f: |
13 |
15 |
16 |
18 |
16 |
15 |
13 |
Solution
|
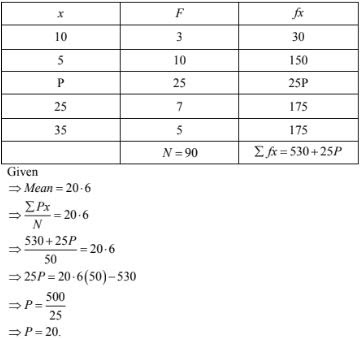
x |
10 |
15 |
P |
25 |
35 |
|
f |
3 |
10 |
25 |
7 |
5 |
|
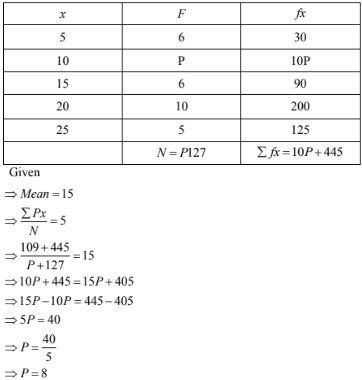
x |
5 |
10 |
15 |
20 |
25 |
|
f |
6 |
P |
6 |
10 |
5 |
|
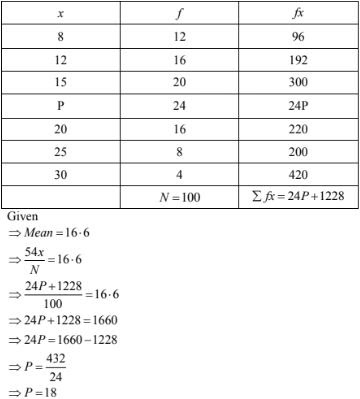
x |
8 |
12 |
15 |
P |
20 |
25 |
30 |
|
f |
12 |
16 |
20 |
24 |
16 |
8 |
4 |
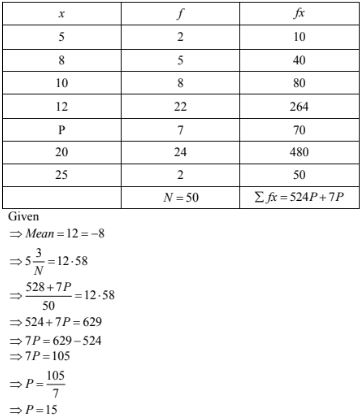
6. Find the missing value of p for the following distribution whose mean is 12.58
|
x |
5 |
8 |
10 |
12 |
P |
20 |
25 |
|
f |
2 |
5 |
8 |
22 |
7 |
4 |
2 |
|
x |
3 |
5 |
7 |
9 |
11 |
13 |
|
f |
6 |
8 |
15 |
P |
8 |
4 |
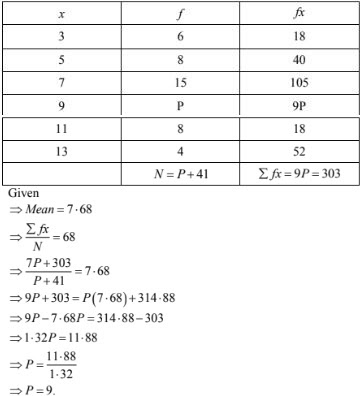
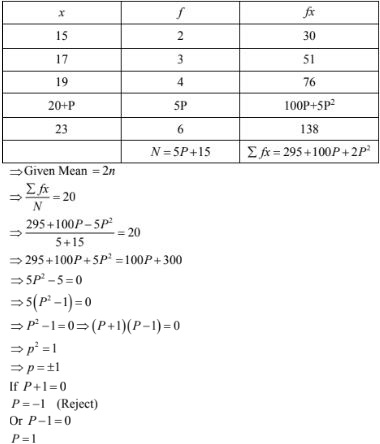
8. Find the value of p, if the mean of the following distribution is 20.
|
x |
15 |
17 |
19 |
20+p |
23 |
|
f |
2 |
3 |
4 |
5p |
6 |
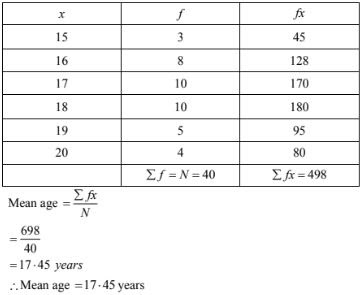
Calculate the mean age of the students.
|
Age(in years) |
15 |
16 |
17 |
18 |
19 |
20 |
|
No. of students: |
3 |
8 |
10 |
10 |
5 |
4 |
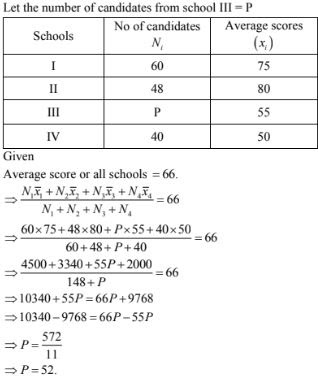
10. Candidates of four schools appear in a mathematics test. The data were as follows:
|
Schools |
No. of Candidates |
Average Score |
|
I |
60 |
75 |
|
II |
48 |
80 |
|
III |
NA |
55 |
|
IV |
40 |
50 |
If the average score of the candidates of all the four schools is 66, find the number of candidates that appeared from school III.
Solution
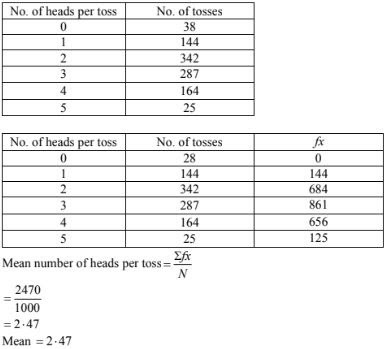
|
No. of heads per toss |
No. of tosses |
|
0 |
38 |
|
1 |
144 |
|
2 |
342 |
|
3 |
287 |
|
4 |
164 |
|
5 |
25 |
|
Total |
1000 |
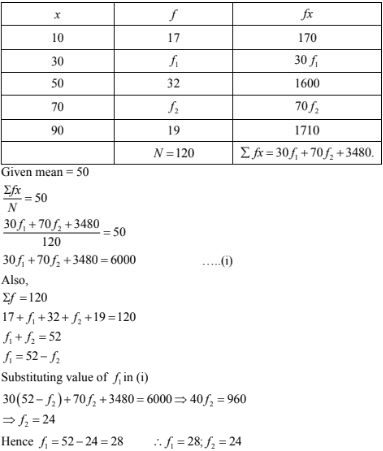
12. Find the missing frequencies in the following frequency distribution if it is known that the mean of the distribution is 50.
|
X |
10 |
30 |
50 |
70 |
90 |
|
F |
17 |
F1 |
32 |
F2 |
19 |

|
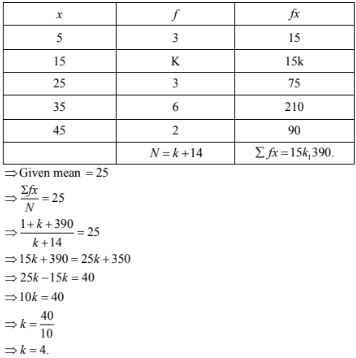
Xi |
5 |
10 |
15 |
20 |
25 |
|
Fi |
7 |
K |
8 |
4 |
5 |
|
Xi |
5 |
15 |
25 |
35 |
45 |
|
Fi |
3 |
K |
3 |
6 |
2 |
|
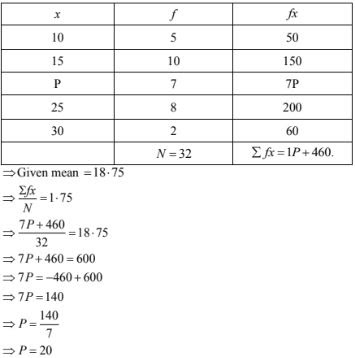
Xi |
10 |
15 |
P |
25 |
30 |
|
Fi |
5 |
10 |
7 |
8 |
2 |