ICSE Solutions for Selina Concise Chapter 18 Statistics Class 9 Maths

Exercise 18(A)
1.State, which of the following variables are continuous and which are discrete:
(a) Number of children in your class.
(b) Distance travelled by a car.
(c) Sizes of shoes.
(d) Time.
(e) Number of patients in a hospital.
Answer(a) Discrete variable.
(b) Continuous variable.
(c) Discrete variable.
(d) Continuous variable.
(e) Discrete variable.
2. Given below are the marks obtained by 30 students in an examination:
| 08 | 17 | 33 | 41 | 47 | 23 | 20 | 34 |
| 09 | 18 | 42 | 14 | 30 | 19 | 29 | 11 |
| 36 | 48 | 40 | 24 | 22 | 02 | 16 | 21 |
| 15 | 32 | 47 | 44 | 33 | 01 |
Taking class intervals 1 – 10, 11 – 20, ….., 41 – 50; make a frequency table for the above distribution.
AnswerThe frequency table for the given distribution is

3. The marks of 24 candidates in the subject mathematics are given below:
| 45 | 48 | 15 | 23 | 30 | 35 | 40 | 11 |
| 29 | 0 | 3 | 12 | 48 | 50 | 18 | 30 |
| 15 | 30 | 11 | 42 | 23 | 2 | 3 | 44 |
The maximum marks are 50. Make a frequency distribution taking class intervals 0 – 10, 10-20, ……
AnswerThe frequency table for the given distribution is

In this frequency distribution, the marks 30 are in the class of interval 30–40 and not in 20–30. Similarly, marks 40 are in the class of interval 40–50 and not in 30–40.
4. Fill in the blanks:
(a) A quantity which can very from one individual to another is called a ………….
(b) Sizes of shoes are ……… variables.
(c) Daily temperatures is ……… variable.
(d) The range of the data 7, 13, 6, 25, 18, 20, 16 is ……
(e) In the class interval 35 – 46; the lower limit is …… and upper limit is ……
(f) The class mark of class interval 22 – 29 is ……
Answer(a) Variable.
(b) Discrete variables.
(c) Continuous variable.
(d) The range is
(e) Lower limit is and upper limit is
(f) The class mark is 22- 29 = (22-29)/2 = 51/2 = 25.5
5. Find the actual lower class limits, upper class limits and the mid-values of the classes: 10 – 19, 20 – 29, 30 – 39 and 40 – 49.
AnswerIn case of frequency 10 – 19 the lower class limit is 10, upper class limit is 19 and mid-value is (10 + 19)/2 = 14.5
In case of frequency 20 – 29 the lower class limit is 20, upper class limit is 29 and mid-value is (20+29)/2 = 24.5
In case of frequency 30 – 39 the lower class limit is 30, upper class limit is 39 and mid-value is (30+39)/2 = 34.5
In case of frequency 40 – 49 the lower class limit is 40, upper class limit is 49 and mid-value is (40 + 49)/2 = 44.5
6. Find the actual lower and upper class limits and also the class marks of the classes:
1.1 – 2.0,
2.1 -3.0 and
3.1 – 4.0.
In case of frequency 1.1 – 2.0 the lower class limit is 1.1, upper class limit is 2.0 and class mark is (1.1+2.0)/2 = 1.55
In case of frequency 2.1 – 3.0 the lower class limit is 2.1, upper class limit is 3.0 and class mark is (2.1 + 3.0)/2 = 2.55
In case of frequency 3.1 – 4.0 the lower class limit is 3.1, upper class limit is 4.0 and class mark is (3.1 + 4.0)/2 = 3.55
7. Use the table given below to find:
(a) The actual class limits of the fourth class.
(b) The class boundaries of the sixth class.
(c) The class mark of the third class.
(d) The upper and lower limits of the fifth class.
(e) The size of the third class.
| Class Interval | Frequency |
| 30 – 34 | 7 |
| 35 – 39 | 10 |
| 40 – 44 | 12 |
| 45 – 49 | 13 |
| 50 – 54 | 8 |
| 55 – 59 | 4 |
(a) The actual class limit of the fourth class will be:
44.5-49.5.
(b) The class boundaries of the sixth class will be:
54.5-59.5
(c) The class mark of the third class will be the average of the lower bound and the upper bound of the interval. Therefore class mark will be:
(40+44)/2 = 42
(d) The upper and lower limit of the fifth class is 54 and 50 respectively.
(e) The size of the third class will be: 44 – 40 + 1 =5.
8. Construct a cumulative frequency distribution table from the frequency table given below:
(i)
| Class Interval | Frequency |
| 0 – 8 | 9 |
| 8 – 16 | 13 |
| 16 – 24 | 12 |
| 24 – 32 | 7 |
| 32 – 40 | 15 |
(ii)
| Class Interval | Frequency |
| 1 – 10 | 12 |
| 11 – 20 | 18 |
| 21 – 30 | 23 |
| 31 – 40 | 15 |
| 41 – 50 | 10 |
(i) The cumulative frequency distribution table is

(ii) The cumulative frequency distribution table is

9. Construct a frequency distribution table from the following cumulative frequency distribution:
(i)
| Class Interval | Cumulative Frequency |
| 10 – 19 | 8 |
| 20 – 29 | 19 |
| 30 – 39 | 23 |
| 40 – 49 | 30 |
(ii)
| C.I. | C.F. |
| 5 – 10 | 18 |
| 10 -15 | 30 |
| 15 -20 | 46 |
| 20 -25 | 73 |
| 25 -30 | 90 |
(i) The frequency distribution table is
| Class Interval | Frequency |
| 10 – 19 | 8 |
| 20 – 29 | 11 |
| 30 – 39 | 4 |
| 40 – 49 | 7 |
(ii) The frequency distribution table is
| C.I. | .F. |
| 5 – 10 | 18 |
| 10 -15 | 12 |
| 15 -20 | 16 |
| 20 -25 | 27 |
| 25 -30 | 17 |
10. Construct a frequency table from the following data:
| Marks | No. of students |
| less than 10 | 6 |
| less than 20 | 15 |
| less than 30 | 30 |
| less than 40 | 39 |
| less than 50 | 53 |
| less than 60 | 70 |
The frequency table is
| Marks | c f |
| 0- 10 | 6 |
| 10- 20 | 9 |
| 20- 30 | 15 |
| 30- 40 | 9 |
| 40-50 | 14 |
| 50- 60 | 17 |
11. Construct the frequency distribution table from the following cumulative frequency table:
| Ages | No. of students |
| Below 4 | 0 |
| Below 7 | 85 |
| Below 10 | 140 |
| Below 13 | 243 |
| Below 16 | 300 |
(i) State the number of students in the age group 10–13.
(ii) State the age-group which has the least number of students.
AnswerThe frequency distribution table is
| C I | c f |
| 0- 4 | 0 |
| 4-7 | 85 |
| 7-10 | 55 |
| 10- 13 | 103 |
| 13-16 | 57 |
(i) The number of students in the age group is 10-13 is 103.
(ii) The age group which has the least number of students is 7-10.
12. Fill in the blanks in the following table:
| Class Interval | Frequency | Cumulative Frequency |
| 25 – 34 | …… | 15 |
| 35 – 44 | …… | 28 |
| 45 – 54 | 21 | …… |
| 55 – 64 | 16 | …… |
| 65 – 74 | …… | 73 |
| 75 – 84 | 12 | …… |
| Class Interval | Frequency | Cumulative Frequency |
| 25 – 34 | …15… | 15 |
| 35 – 44 | …13… | 28 |
| 45 – 54 | 21 | …49… |
| 55 – 64 | 16 | …65… |
| 65 – 74 | …8… | 73 |
| 75 – 84 | 12 | …85… |
13. The value of π upto 50 decimal place is
3.14159265358979323846264338327950288419716939937510
(i) Make a frequency distribution table of digits from 0 to 9 after the decimal place.
(ii) Which are the most and least occurring digits?
Answer| X | 0 | 1 | 2 | 3 | 4 | 5 | 6 | 7 | 8 | 9 |
| F | 2 | 5 | 5 | 8 | 4 | 5 | 4 | 4 | 5 | 8 |
Most occurring digits are 3 and 9. Least occurring digits are 0.
Exercise 18(B)
1. Construct a frequency polygon for the following distribution:
| Class-intervals | 0 – 4 | 4 – 8 | 8 – 12 | 12 – 16 | 16 – 20 | 20 – 24 |
| Frequency | 4 | 7 | 10 | 15 | 11 | 6 |
The frequency polygon is shown in the following figure

Class Interval
Steps:
- Drawing a histogram for the given data.
- Marking the mid-point at the top of each rectangle of the histogram drawn.
- Also, marking mid-point of the immediately lower class-interval and mid-point of the immediately higher class-interval.
- Joining the consecutive mid-points marked by straight lines to obtain the required frequency polygon.
2. Construct a combined histogram and frequency polygon for the following frequency distribution:
| Class-Intervals | 10 -20 | 20 – 30 | 30 – 40 | 40 – 50 | 50 – 60 |
| Frequency | 3 | 5 | 6 | 4 | 2 |
Steps:
- Draw a histogram for the given data.
- Mark the mid-point at the top of each rectangle of the histogram drawn.
- Also, mark the mid-point of the immediately lower class-interval and mid-point of the immediately higher class-interval.
- Join the consecutive mid-points marked by straight lines to obtain the required frequency polygon.
The required combined histogram and frequency polygon is shown in the following figure:

Class Interval
3. Construct a frequency polygon for the following data:
| Class-Intervals | 10 -14 | 15 – 19 | 20 – 24 | 25 – 29 | 30 – 34 |
| Frequency | 5 | 8 | 12 | 9 | 4 |
The class intervals are inclusive. We will first convert them into the exclusive form.
| Class-Interval | Frequency |
| 9.5 – 14.5 | 5 |
| 14.5 – 19.5 | 8 |
| 19.5 – 24.5 | 12 |
| 24.5 – 29.5 | 9 |
| 29.5 – 34.5 | 4 |
Steps:
- Draw a histogram for the given data.
- Mark the mid-point at the top of each rectangle of the histogram drawn.
- Also, mark the mid-point of the immediately lower class-interval and mid-point of the immediately higher class-interval.
- Join the consecutive mid-points marked by straight lines to obtain the required frequency polygon.
The required frequency polygon is as follows:

4. The daily wages in a factory are distributed as follows:
| Daily wages (in Rs.) | 125-175 | 175 – 225 | 225 – 275 | 275 – 325 | 325 – 375 |
| Number of workers | 4 | 20 | 22 | 10 | 6 |
Draw a frequency polygon for this distribution.
AnswerSteps:
- Draw a histogram for the given data.
- Mark the mid-point at the top of each rectangle of the histogram drawn.
- Also, mark the mid-point of the immediately lower class-interval and mid-point of the immediately higher class-interval.
- Join the consecutive mid-points marked by straight lines to obtain the required frequency polygon.
The required frequency polygon is as follows:

5 (i). Draw frequency polygons for each of the following frequency distribution:
(a) using histogram
(b) without using histogram
| C.I | 10 – 30 | 30 – 50 | 50 – 70 | 70 – 90 | 90 – 110 | 110 – 130 | 130 – 150 |
| ƒ | 4 | 7 | 5 | 9 | 5 | 6 | 4 |
(a) Using Histogram:
| C.I. | f |
| 10 – 30 | 4 |
| 30 – 50 | 7 |
| 50 – 70 | 5 |
| 70 – 90 | 9 |
| 90 – 110 | 5 |
| 110 – 130 | 6 |
| 130 – 150 | 4 |
Steps:
- Draw a histogram for the given data.
- Mark the mid-point at the top of each rectangle of the histogram drawn.
- Also, mark the mid-point of the immediately lower class-interval and mid-point of the immediately higher class-interval.
- Join the consecutive mid-points marked by straight lines to obtain the required frequency polygon.

(b) Without using Histogram:
Steps:
- Find the class-mark (mid-value) of each given class-interval.
- On a graph paper, mark class-marks along X-axis and frequencies along Y-axis.
- On this graph paper, mark points taking values of class-marks along X-axis and the values of their corresponding frequencies along Y-axis.
- Draw line segments joining the consecutive points marked in step (3) above.
| C.I. | Class-mark | f |
| -10 – 10 | 0 | 0 |
| 10 – 30 | 20 | 4 |
| 30 – 50 | 40 | 7 |
| 50 – 70 | 60 | 5 |
| 70 – 90 | 80 | 9 |
| 90 – 110 | 100 | 5 |
| 110 – 130 | 120 | 6 |
| 130 – 150 | 140 | 4 |
| 150 – 170 | 160 | 0 |

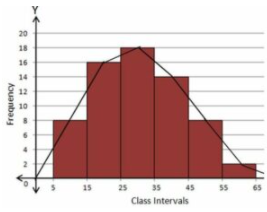
5(ii). Draw frequency polygons for each of the following frequency distribution:
(a) using histogram
(b) without using histogram
| C.I | 5 – 15 | 15 – 25 | 25 – 35 | 35 – 45 | 45 – 55 | 55 – 65 |
| ƒ | 8 | 16 | 18 | 14 | 8 | 2 |
Using Histogram:
| C.I. | f |
| 5 – 15 | 8 |
| 15 – 25 | 16 |
| 25 – 35 | 18 |
| 35 – 45 | 14 |
| 45 – 55 | 8 |
| 55 – 65 | 2 |
Steps:
- Draw a histogram for the given data.
- Mark the mid-point at the top of each rectangle of the histogram drawn.
- Also, mark the mid-point of the immediately lower class-interval and mid-point of the immediately higher class-interval.
- Join the consecutive mid-points marked by straight lines to obtain the required frequency polygon.
Without using Histogram:
Steps:
- Find the class-mark (mid-value) of each given class-interval.
- On a graph paper, mark class-marks along X-axis and frequencies along Y-axis.
- On this graph paper, mark points taking values of class-marks along X-axis and the values of their corresponding frequencies along Y-axis.
- Draw line segments joining the consecutive points marked in step (3) above.
| C.I. | Class-mark | f |
| -5 – 5 | 0 | 0 |
| 5 – 15 | 10 | 8 |
| 15 – 25 | 20 | 16 |
| 25 – 35 | 30 | 18 |
| 35 – 45 | 40 | 14 |
| 45 – 55 | 50 | 8 |
| 55 – 65 | 60 | 2 |
| 65 – 75 | 70 | 0 |
