Chapter 13 Statistics and Probability NCERT Exemplar Solutions Exercise 13.4 Class 10 Maths
Chapter Name | NCERT Maths Exemplar Solutions for Chapter 13 Statistics and Probability Exercise 13.4 |
Book Name | NCERT Exemplar for Class 10 Maths |
Other Exercises | - Exercise 13.1
- Exercise 13.2
- Exercise 13.3
|
Related Study | NCERT Solutions for Class 10 Maths |
Exercise 13.4 Solutions
1. Find the mean marks of students for the following distribution.
|
Marks
|
Number of students
|
|
0 and above
|
80
|
|
10 and above
|
77
|
|
20 and above
|
72
|
|
30 and above
|
65
|
|
40 and above
|
55
|
|
50 and above
|
43
|
|
60 and above
|
28
|
|
70 and above
|
16
|
|
80 and above
|
10
|
|
90 and above
|
8
|
|
100 and above
|
0
|
Solution
|
Marks
|
Class marks (xi)
|
Number of students
(cumulative frequency)
|
fi
|
fi xi
|
|
0 – 10
|
5
|
80
|
3
|
15
|
|
10 – 20
|
15
|
77
|
5
|
75
|
|
20 – 30
|
25
|
72
|
7
|
175
|
|
30 – 40
|
35
|
65
|
10
|
350
|
|
40 – 50
|
45
|
55
|
12
|
540
|
|
50 – 60
|
55
|
43
|
15
|
825
|
|
60 – 70
|
65
|
28
|
12
|
780
|
|
70 – 80
|
75
|
16
|
6
|
450
|
|
80 – 90
|
85
|
10
|
2
|
170
|
|
90 – 100
|
95
|
8
|
8
|
760
|
|
100 – 110
|
105
|
0
|
0
|
0
|
|
|
|
|
|
Σfi xi = 4140
|
Mean = (Σfi xi)/ N = 4140/80 = 51.75
2.
|
Marks
|
Number of students
|
|
Below 10
|
5
|
|
Below 20
|
9
|
|
Below 30
|
17
|
|
Below 40
|
29
|
|
Below 50
|
45
|
|
Below 60
|
60
|
|
Below 70
|
70
|
|
Below 80
|
78
|
|
Below 90
|
83
|
|
Below 100
|
85
|
Solution
Here, we observe that, 5 students have scored marks below 10, i.e. it lies between class interval 0-10 and 9 students have scored marks below 20,
So, (9 – 5) = 4 students lies in the class interval 10-20. Continuing in the same manner, we get the complete frequency distribution table for given data.
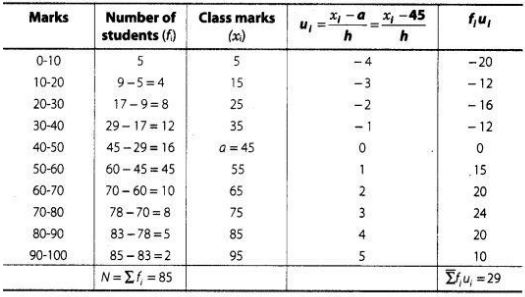
Here, (assumed mean) a = 45
and (class width) h = 10
By step deviation method,
Mean (
x) = a + (Σf
i u
i)/(Σf
i) × h
= 45 + (29/85) ×10
= 45 + 58/17
= 45 + 3.41
= 48.41
3. Find the mean age of 100 residents of a town from the following data.
|
Age equal and above (in years)
|
0
|
10
|
20
|
30
|
40
|
50
|
60
|
70
|
|
Number of persons
|
100
|
90
|
75
|
50
|
25
|
15
|
5
|
0
|
Solution
Here, we observe that, all 100 residents of a town have age equal and above 0. Since, 90
residents of a town have age equal and above 10.
So, 100 – 90 = 10 residents lies in the interval 0-10 and so on. Continue in this manner, we
get frequency of all class intervals. Now, we construct the frequency distribution table.
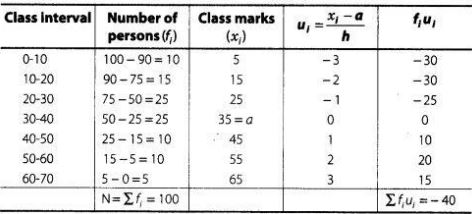
Here, (assumed mean) a = 35
and (class width) h = 10
By step deviation method,
Mean (
x) = a + (Σf
i u
i)/(Σf
i) × h
= 35 + (-40/100) × 10
= 35 - 4 = 31 .
Hence, the required mean age is 31 yr.
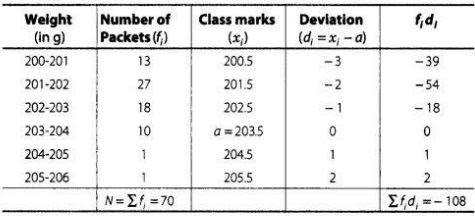
4. The weights of tea in 70 packets are shown in the following table
|
Weight (in g)
|
Number of packets
|
|
200 – 201
|
13
|
|
201 – 202
|
27
|
|
202 – 203
|
18
|
|
203 – 204
|
10
|
|
204 – 205
|
1
|
|
205 – 206
|
1
|
Find the mean weight of packets.
Solution
First, we find the class marks of the given data as follows,
Here, (assume mean) a = 203.5
and (class width) h = 1
By assumed mean method,
Mean (x) = a + (Σfi di)/(Σfi)
= 203.5 + 108/70
= 203.5 - 1.54
= 201.96
Hence, the required mean weight is 201.96 g.
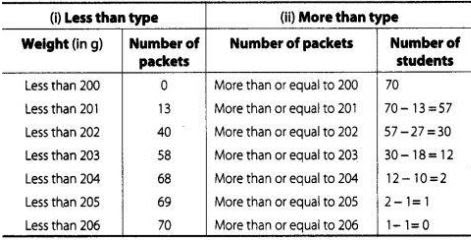
5. Refer to Q.4 above. Draw the less than type ogive for this data and use it to find the median weight.
Solution
We observe that, the number of packets less than 200 is 0, Similarly, less than 201 include the number of packets from 0-200 as well as the number of packets from 200-201.
So, the total number of packets less than 201 is 0 + 13 = 13. We say that, the cumulative
frequency of the class 200-201 is 13. Similarly, for other class.
|
Less than type
|
|
Weight (in g)
|
Number of packets
|
|
Less than 200
|
0
|
|
Less than 201
|
0 + 13 = 13
|
|
Less than 202
|
27 + 13 = 40
|
|
Less than 203
|
18 + 40 = 58
|
|
Less than 204
|
10 + 58 = 68
|
|
Less than 205
|
1 + 68 = 69
|
|
Less than 206
|
1 + 69 = 70
|
To draw the less than type ogive, we plot the points (200, 0), (201, 13), (202, 40), (203, 58), (204, 68), (205, 69) and (206, 70) on the paper and join by free hand, v Total number of packets (n) = 70
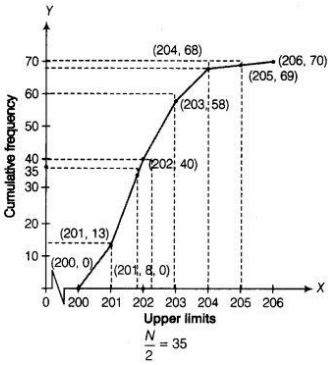
Now,
Firstly, we plot a point (0, 35) on Y-axis and draw a line y = 35 parallel to X-axis. The line cuts the less than ogive curve at a point. We draw a line on that point which is perpendicular to X-axis. The foot of the line perpendicular to X-axis is the required median.
Median weight = 201.8 g
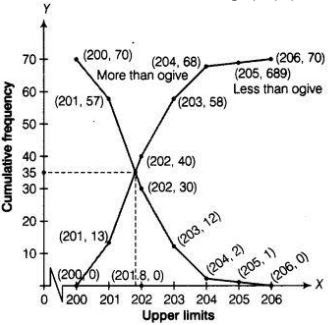
6. Refer to Q.5 above. Draw the less than type and more than type ogives for the data and use them to find the meadian weight.Solution
For less than type table we follow the Q.5.
Here, we observe that, the weight of all 70 packets is more than or equal to 200. Since, 13 packets lie in the interval 200-201. So, the weight of 70 -13 = 57 packets is more than or equal to 201. Continuing in this manner we will get remaining more than or equal to 202,
203, 204, 205 and 206.
To draw the less than type ogive, we plot the points (200, 0), (201,13), (202, 40), (203, 58),
(204, 68), (205,69), (206, 70) on the paper and join them by free hand.
To draw the more than type ogive plot the points (200, 70), (201, 57), (202, 30), (203, 12),
(204, 2), (205,1), (206, 0) on the the graph paper and join them by free hand.
Hence, required median weight = intersection point of x - axis = 201.8 g.
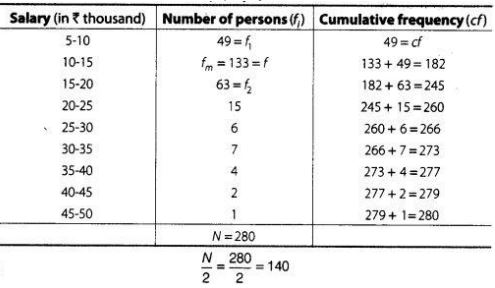
7. The table below shows the salaries of 280 persons.
|
Salary (in ₹ thousand)
|
Number of persons
|
|
5 – 10
|
49
|
|
10 – 15
|
133
|
|
15 – 20
|
63
|
|
20 – 25
|
15
|
|
25 – 30
|
6
|
|
30 – 35
|
7
|
|
35 – 40
|
4
|
|
40 – 45
|
2
|
|
45 – 50
|
1
|
Calculate the median and mode of the data.
Solution
First, we construct a cumulative frequency table.
(i) Here, median class is 10 - 15 , because 140 lies in it.
Lower limit(
l) = 10, Frequency (f) = 133,
Cumulative frequency (cf) = 49 and class width (h) = 5
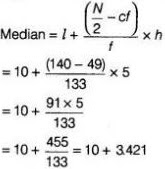
= ₹ 13.421 (in thousand)
= 13.421 × 1000
= ₹ 13421
(ii) Here, the highest frequency is 133, which lies in the interval 10 - 15 , called modal class.
Lower limit(
l) = 10, class width (h) = 5, f
m = 133, f
1 = 49, and f
2 = 63.
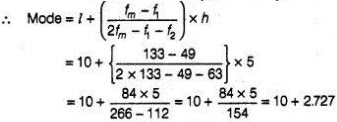
= ₹ 12.727 (in thousand)
= 12.727 × 1000 = ₹ 12727
Hence, the median and modal salary are ₹ 13421 and ₹12727, respectively.
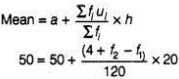
8. The mean of the following frequency distribution is 50 but the frequencies f1 and f2 in classes 20-40 and 60-80, respectively are not known. Find these frequencies, if the sum of all the frequencies is 120.
|
Class
|
0 – 20
|
20 – 40
|
40 – 60
|
60 – 80
|
80 – 100
|
|
Frequency
|
17
|
f1
|
32
|
f2
|
19
|
Solution
First we calculate the class mark of given data
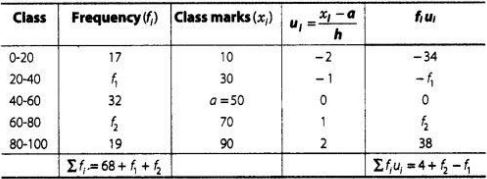
Given that, sum of all frequencies = 120
⇒ Σf
i = 68 + f
1 + f
2 = 120
⇒ f
1 + f
2 = 52
Here, (assumed mean) a = 50
and (class width) h = 20
By step deviation method,
⇒ 4 + f
2 - f
1 = 0
⇒ - f
2 + f
1 = 4
On adding Eqs. (i) and (ii), we get
2f1 = 56
⇒ f1 = 28
Put the value of f1 in Eq. (i), we get
f2 = 52 - 28
⇒ f2 = 24
Hence, f1 = 28 and f2 = 24.
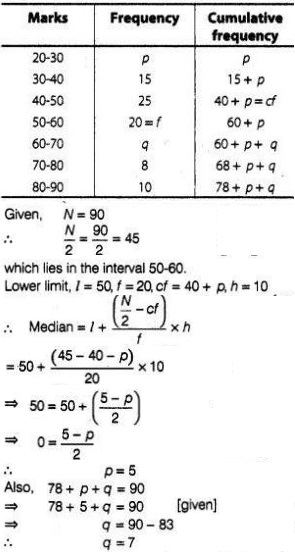
9. The median of the following data is 50. Find the values of p and q, if the sum of all the frequencies is 90.
|
Marks
|
Frequency
|
|
20 – 30
|
Ρ
|
|
30 – 40
|
15
|
|
40 – 50
|
25
|
|
50 – 60
|
20
|
|
60 – 70
|
q
|
|
70 – 80
|
8
|
|
80 – 90
|
10
|
Solution
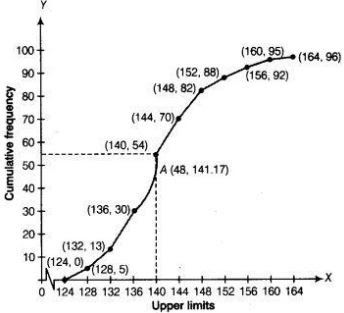
10. The distribution of heights (in cm) of 96 children is given below
|
Height (in cm)
|
Number of children
|
|
124 – 128
|
5
|
|
128 – 132
|
8
|
|
132 – 136
|
17
|
|
136 – 140
|
24
|
|
140 – 144
|
16
|
|
144 – 148
|
12
|
|
148 – 152
|
6
|
|
152 – 156
|
4
|
|
156 – 160
|
3
|
|
160 – 164
|
1
|
Draw a less than type cumulative frequency curve for this data and use it to compute
median height of the children.
Solution
|
Height (in cm)
|
Number of children
|
|
Less than 124
|
0
|
|
Less than 128
|
5
|
|
Less than 132
|
13
|
|
Less than 136
|
30
|
|
Less than 140
|
54
|
|
Less than 144
|
70
|
|
Less than 148
|
82
|
|
Less than 152
|
88
|
|
Less than 156
|
92
|
|
Less than 160
|
95
|
|
Less than 164
|
96
|
To draw the less than type ogive, we plot the points (124, 0), (128, 5), (132, 13), (136, 30), (140, 54), (144, 70), (148, 82), (152, 88), (156, 92), (160, 95), (164, 96) and join all these point by free hand.
Here, N/2 = 96/2
We take, y = 48 in Y-coordinate and draw a line parallel to X-axis, meets the curve at A and draw a perpendicular line from point A to the X-axis and this line meets the X-axis at the point which is the median i.e., median = 141.17.
11. Size of agricultural holdings in a survey of 200 families is given in the following Compute median and mode size of the holdings.
|
Size of agricultural holdings(in hec)
|
Number of families
|
|
0 – 5
|
10
|
|
5 – 10
|
15
|
|
10 – 15
|
30
|
|
15 – 20
|
80
|
|
20 – 25
|
40
|
|
25 – 30
|
20
|
|
30 – 35
|
5
|
Solution
|
Size of agricultural holdings(in hec)
|
Number of families (fi)
|
Cumulative frequency
|
|
0 – 5
|
10
|
10
|
|
5 – 10
|
15
|
25
|
|
10 – 15
|
30
|
55
|
|
15 – 20
|
80
|
135
|
|
20 – 25
|
40
|
175
|
|
25 – 30
|
20
|
195
|
|
30 – 35
|
5
|
200
|
(i) Here, N = 200
Now, N/2 = 200/2 = 100, which lies in the interval 15 - 20 .
Lower limit, l = 15, h = 5, f = 80 and cf = 55
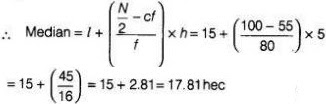
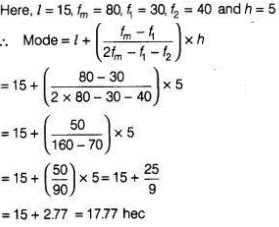
(ii) In a given table 80 is the highest frequency.
So, the modal class is 15 - 20 .
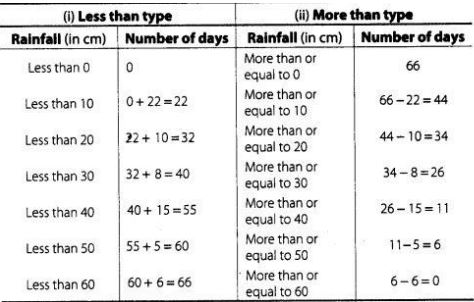
12. The annual rainfall record of a city for 66 days is given in the following table.
|
Rainfall(in cm)
|
0 – 10
|
10 – 20
|
20 – 30
|
30 – 40
|
40 – 50
|
50 – 60
|
|
Number of days
|
22
|
10
|
8
|
15
|
5
|
6
|
Calculate the median rainfall using ogives (or move than type and of less than type)
Solution
We observe that, the annual rainfall record of a city less than 0 is 0. Similarly, less than 10 include the annual rainfall record of a city from 0 as well as the annual rainfall record of a city from 0-10.v
So, the total annual rainfall record of a city for less than 10 cm is 0+ 22 =22 days.
Continuing in this manner, we will get remaining less than 20, 30, 40, 50, and 60.
Also, we observe that annual rainfall record of a city for 66 days is more than or equal to 0 cm. Since, 22 days lies in the interval 0-10. So, annual rainfall record for 66-22 = 44days is more than or
equal to 10 cm.
Continuing in this manner we will get remaining more than or equal to 20, 30, 40, 50 and 60.
Now, we construct a table for less than and more than type.
To draw less than type ogive we plot the points (0, 0), (10, 22), (20, 32), (30, 40), (40, 55), (50, 60), (60, 66) on the paper and join them by free hand.To draw the more than type ogive we plot the points (0, 66), (10, 44), (20, 34), (30, 26), (40, 11), (50, 6) and (60, 0) on the graph paper and join them by free hand,
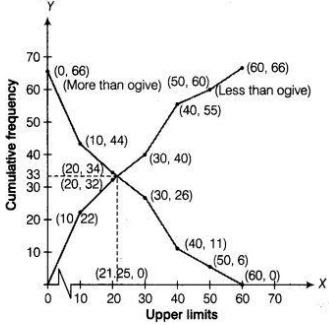
∵ Total number of days(n) = 66
Now, n/2 = 33
Firstly, we plot a line parallel to X-axis at intersection point of both ogives, which further intersect at (0, 33) on Y-axis. Now, we draw a line perpendicular to X-axis at intersection point of both ogives, which further intersect at (21.25, 0) on X-axis. Which is the required median using ogives.
Hence, median rainfall = 21.25 cm.
13. The following is the frequency distribution of duration for 100 calls made on a mobile phone.
|
Duration (in s)
|
Number of calls
|
|
95 – 125
|
14
|
|
125 – 155
|
22
|
|
155 – 185
|
28
|
|
185 – 215
|
21
|
|
215 – 245
|
15
|
Solution
First, we calculate class marks as follows :
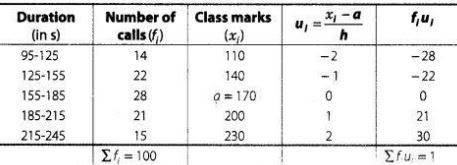
Here, (assumed mean) a = 170,
and (class width)h = 30
By step deviation method,
Hence, average duration is 170.3 s .
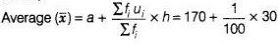
For calculating median from a cumulative frequency curve
We prepare less than type or more than type ogive
We observe that, number of calls in less than 95 s is 0. Similarly, in less than 125 s include
the number of calls in less than 95 s as well as the number of calls from 95-125.s So, the
total number of calls less than 125 s is 0 + 14 = 14. Continuing in this manner, we will get
remaining in less than 155,185, 215 and 245 s.
Now, we construct a table for less than ogive (cumulative frequency curve).
∵ Total number of calls (n) = 100
∴ n/2 = 100/2 = 50
Now, point 50 taking on Y-axis draw a line parallel to X-axis meet at a point P and draw a perpendicular line from P to the X-axis, the intersection point of X-axis is the median.
Hence, required median is 170 .
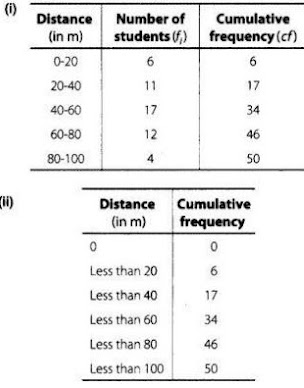
|
Distance (in m)
|
0 – 20
|
20 – 40
|
40 – 60
|
60 – 80
|
80 – 100
|
|
Number of students
|
6
|
11
|
17
|
12
|
4
|
(i) Construct a cumulative frequency table.
(ii) Draw a cumulative frequency curve (less than type) and calculate the median distance
drawn by using
this curve.
(iii) Calculate the median distance by using the formula for median.
(iv) Are the median distance calculated in (ii) and (iii) same?
Solution
To draw less than type ogive, we plot the points (0, 0), (20, 6), (40,17), (60, 34), (80, 46), (100, 50), join all these points by free hand.
Now, n/2 = 50/2 = 25
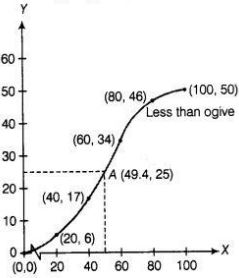
Taking Y = 25 on y-axis and draw a line parallel to X-axis, which meets the curve at point A From point A we draw a line perpendicular to X-axis, where this meets that point is the required median i.e., 49.4.
(iii) Now, N/2 = 50/2 = 25
which lies is the interval 40 - 60 .
∴
l = 40, h = 20, cf = 17 and f = 17
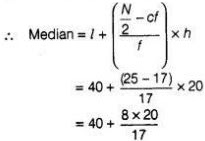
= 40 + 9.41
= 49.41
(iv) Yes, median distance calculated by parts (ii) and (iii) are same.