Chapter 13 Statistics and Probability NCERT Exemplar Solutions Exercise 13.1 Class 10 Maths

Chapter 13 Statistics and Probability NCERT Exemplar Solutions Exercise 13.1 Class 10 Maths

Chapter Name

NCERT Maths Exemplar Solutions for Chapter 13 Statistics and Probability Exercise 13.1

Book Name

NCERT Exemplar for Class 10 Maths

Other Exercises

  • Exercise 13.2
  • Exercise 13.3
  • Exercise 13.4

Related Study

NCERT Solutions for Class 10 Maths

Exercise 13.1 Solutions

Multiple Choice Questions 

1. In the formula  
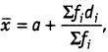
for finding the mean of grouped data di 's = are deviation from a of
(a) lower limits of the classes
(b) upper limits of the classes
(c) mid-points of the classes
(d) frequencies of the class marks

Solution

(c)  We know that, di = xi-a 
i.e., di 's are the deviation from a of mid - points of the classes.


2. While computing mean of grouped data, we assume that the frequencies are
(a) evenly distributed over all the classes
(b) centred at the class marks of the classes
(c) centred at the upper limits of the classes
(d) centred at the lower limits of the classes

Solution

(b) In computing the mean of grouped data, the frequencies are centred at the class marks of the classes.


3. If xi 's are the mid - points of the class intervals of grouped data fi 's are the corresponding frequencies and x  is the mean , then Σ(fi xi - x  ) is equal to 
(a) 0
(b) -1
(c) 1
(d) 2 

Solution


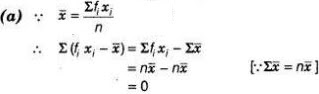
4. In the formula x = a + h [(Σ(fiui)/(Σ(fi)], for finding the mean of grouped frequency distribution ui is equal to 

(a) (xi + a)/h 
(b) h(xi - a)  
(c) (xi - a)/h 
(d) (a - xi )/h 

Solution


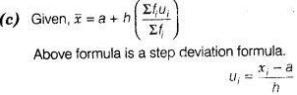
5. The abscissa of the point of intersection of the less than type and of the more than type cumulative frequency curves of a grouped data gives its
(a) mean
(b) median
(c) mode
(d) All of these 

Solution

(b) Since, the intersection point of less than ogive and more than ogive gives the median on the abscissa.


6. For the following distribution, 

Class

0 – 5

5 – 10

10 – 15

15 – 20

20 – 25

Frequency

10

15

12

20

the sum of lower limits of the median class and modal class is 

(a)  15 
(b)  25 
(c)  30

Solution

(b) Here, 

Class

Frequency

Cumulative frequency

0 – 5

10

10

5 – 10

15

25

10 – 15

12

37

15 – 20

20

57

20 – 25

9

66

Now, N/2 = 66/2 = 33, which lies in the interval 10 - 15 . Therefore, lower limit of the median class is 10.

The highest frequency is 20, which lies in the interval 15-20. Therefore, lower limit of modal class is 15. Hence, required sum is 10 + 15 = 25.


7. For the following distribution, 

Class

0 – 5

6 – 11

12 – 27

18 – 23

24 – 29

Frequency

13

10

15

8

11

The upper limit of the median class is 
(a) 7
(b) 17.5
(c) 18
Solution

Class

Frequency

Cumulative frequency

−0.5 – 5.5

13

13

5.5 – 11.5

10

23

11.5 – 17.5

15

38

17.5 – 23.5

8

46

23.5 – 29.5

11

57

Here, N/2 = 57/2 = 28.5 which lies in the interval 11.5 -17.5
Hence, upper limit of median class is 17.5

8. For the following distribution, 

Marks

Number of students

Below 10

3

Below 20

12

Below 30

27

Below 40

57

Below 50

75

Below 60

80

the modal class is
(a) 10 - 20
(b) 20 - 30
(c) 30 - 40
Solution
(c) 

Marks

Number of students

Cumulative frequency

Below 10

3 = 3

3

10 – 20

(12 – 3) = 9

12

20 – 30

(27 – 12) = 15

27

30 – 40

(57 – 27) = 30

57

40 – 50

(75 – 57) = 18

75

50 – 60

(80 – 75) = 5

80

Here, we see that the highest frequency is 30. which lies in the interval  30-40.

9. consider the data 

Class

65 – 85

85 – 105

105 – 125

125 – 145

145 – 165

165 – 185

185 – 205

Frequency

4

5

13

20

14

7

4

The difference of the upper limit of the median class and the lower limit of the modal class is 
(a) 0 
(b) 19 
(c) 20 
(d) 38 
Solution
(c) 

Class

Frequency

Cumulative frequency

65 – 85

4

4

85 – 105

5

9

 105 – 125

13

22

125 – 145

20

42

145 – 165

14

56

165 – 185

7

63

185 – 205

4

67

Here, N/2 = 67/2 = 33.5 which lies in the interval 125 -145.
Hence, upper limit of median class is 145.
Here, we see that the highest frequency is 20 which lies in 125-145. Hence, the lower limit of
modal class is 125.
Required difference = Upper limit of median class – Lower limit of modal class
= 145-125 = 20

10. The times (in seconds) taken by 150 atheletes to run a 110 m hurdle race are tabulated
below

Class

13.8 – 14

14 – 14.2

14.2 – 14.4

14.4 – 14.6

14.6 – 14.8

14.8 – 15

Frequency

2

4

5

71

48

20

The number of atheletes who completed the race in less than 14.6 s is 
(a) 11 
(b) 71 
(c) 82 
(d) 130 
Solution
(c) The number of atheletes who completed the race in less than 14.6
= 2 + 4+ 5+71 =82

11. Consider the following distribution 

Marks obtained

Number of students

More than or equal to 0

63

More than or equal to 10

58

More than or equal to 20

55

More than or equal to 30

51

More than or equal to 40

48

More than or equal to 50

42

the frequency of the class 30 - 40 is 
(a) 3 
(b) 4 
(c) 3 
(d) 4 
Solution
(a) 

Marks obtained

Number of students

0 – 10

(63 – 58) = 5

10 – 20

(58 – 55) = 3

20 – 30

(55 – 51) = 4

30 – 40

(51 – 48) = 3

40 – 50

(48 – 42) = 6

50…..

42 = 42

Hence, frequency in the class interval 30 - 40 is 3 

12. If an event cannot occur, then its probability is 
(a) 1 
(b) 3/4 
(c) 1/2 
(d) 0
Solution
(d) The event which cannot occur is said to be impossible event and probability of impossible event is zero.

13. Which of the following cannot be the probability of an event ? 
(a) 1/2 
(b) 0.1 
(c) 3 
(d) 17/16 
Solution
(d) Since, probability of an event always lies between 0 and 1.

14. An event is very unlikely to happen. Its probability is closest to
(a) 0.0001
(b) 0.001
(c) 0.01
(d) 0.1
Solution
(a) The probability of an event which is very unlikely to happen is closest to zero and from the given options 0.0001 is closest to zero.

15. If the probability of an event is P, then the probability of its complementary event will be
(a) P -1
(b) P
(c) 1 – P
(d) 1 - 1/p
Solution
(c) Since, probability of an event + probability of its complementary event = 1
So, probability of its complementry event = 1 – Probability of an event = 1 – P

16. The probability expressed as a percentage of a particular occurrence can never be
(a) less than 100
(b) less than 0
(c) greater than 1
(d) anything but a whole number
Solution
(b) We know that, the probability expressed as a percentage always lie between 0 and 100.
So, it cannot be less than 0.

17. If P (A) denotes the probability of an event A, then
(a) P(A) < 0
(b) P(A) > 1
(c) 0 ≤ P(A) ≤ 1
(d) -1 ≤ P(A) ≤ 1
Solution
(c) Since, probability of an event always lies between 0 and 1.

18. If a card is selected from a deck of 52 cards, then the probability of its being a red face card
is
(a) 3/26 
(b) 3/13 
(c) 2/13 
(d) 1/2 
Solution
(c) In a deck of 52 cards, there are 12 face cards i.e.,6 red and 6 black cards.
So, probability of getting a red face card = 6/52 = 3/26 

19. The probability that a non - leap your selected at random will contains 53 Sunday is 
(a) 1/7 
(b) 2/7 
(c) 3/7 
(d) 5/7 
Solution
(a) A non-leap year has 365 days and therefore 52 weeks and 1 day. This 1 day may be Sunday or Monday or Tuesday or Wednesday or Thursday or Friday or Saturday. Thus, out of 7 possibilities, 1 favourable event is the event that the one day is Sunday.
∴ Required probability = 1/7 

20. When a die is thrown, the probability of getting an odd number less than 3 is, 
(a) 1/6
(b) 1/3 
(c) 1/2 
(d) 0 
Solution
(a) When a die-is thrown, then total number of outcomes = 6 Odd number less than 3 is 1
only.
Number of possible outcomes = 1
Required probability = 1/6 

21. A card is drawn from a deck of 52 cards. The event E is that card is not an ace of hearts. The
number of outcomes favourable to E is
(a) 4
(b) 13
(c) 48
(d) 51
Solution
(d) In a deck of 52 cards, there are 13 cards of heart and 1 is ace of heart.
Hence, the number of outcomes favourable to E = 51

22. The probability of getting a bad egg in a lot of 400 is 0.035. The number of bad eggs in the
lot is
(a) 7
(b) 14
(c) 21
(d) 28
Solution
(b) Here, total number of eggs = 400
Probability of getting a bad egg = 0.035
⇒ (Number of bad eggs)/(Total number of eggs) = 0.035 
⇒ (Number of bad eggs)/400 = 0.035 
∴ Number of bad eggs  = 0.035 × 400 = 14 

23. A girl calculates that the probability of her winning the first prize in a lottery is 0.08. If 6000 tickets are sold, then how many tickets has she bought?
(a) 40
(b) 240
(c) 480
(d) 750
Solution 
(c) Given, total number of sold tickets = 6000
Let she bought x tickets.
Then, probability of her winning the first prize = x/6000 = 0.08 
⇒ x = 0.08 × 6000
∴  x = 480 
Hence, she bought 480 tickets. 

24. One ticket is drawn at random from a bag containing tickets numbered 1 to 40. The probability that the selected ticket has a number which is a multiple of 5 is 
(a) 1/5 
(b) 3/5 
(c) 4/5 
(d) 1/3 
Solution
(a) Number of total outcomes = 40
Multiples of 5 between 1 to 40 = 5,10,15,20,25. 30 35, 40
∴ Total number of possible outcomes = 8 
∴ Required probability = 8/40 = 1/5 

25. Someone is asked to take a number from 1 to 100. The probability that it is a prime,is
(a) 1/5 
(b) 6/25 
(c) 1/4 
(d) 13/50 
Solution
(c) Total numbers of outcomes = 100
So, the prime numbers between 1 to 100 are 2, 3, 5, 7,11,13,17,19, 23, 29, 31,37, 41. 43, 47, 53, 56, 61, 67, 71, 73, 79, 83, 89 and 97.
∴ Total number of possible outcomes = 25 
∴ Required probability  = 25/100 = 1/4 

26. A school has five houses A, B, C, D and E. A class has 23 students, 4 from house A, 8 from house B, 5 from house C, 2 from house D and rest from house E. A single student is selected at random to be the class monitor. The probability that the selected student is not from A, B and C is
(a) 4/23 
(b) 6/23 
(c) 8/23 
(d) 17/23
Solution
(b) Total number of students = 23
Number of students in house A, B and C = 4+ 8 + 5 = 17
∴ Remains students  = 23 - 17 = 6 
So, probability that the selected student is not from A, B and C = 6/23
Previous Post Next Post