
Chapter 22 Tabular Representation of Statistical Data RD Sharma Solutions Exercise 22.1 Class 9 Maths

Chapter Name | RD Sharma Chapter 22 Tabular Representation of Statistical Data Exercise 22.1 |
Book Name | RD Sharma Mathematics for Class 10 |
Other Exercises |
|
Related Study | NCERT Solutions for Class 10 Maths |
Exercise 22.1 Solutions
1. What do you understand by the word “statistics” in
(i) Singular form
(ii) Plural form?
Solution
The word “Statistics” is used in both its singular as well as its plural senses.
(i) In singular sense: Statistics may be defined as the science of collection, presentation, analysis and interpretation of numerical data
(ii) In plural sense: Statistics means numerical facts or observations collected with definite purpose
(iii) For example: Income and expenditure of persons in a particular locality, number males and females in a particular town are statistics.
2. Describe some fundamental characteristics of statistics.
Solution
Fundamental characteristics of statistics:
(i) A single observation does not form statistics are a sum total of observation
(ii) Statics are expressed quantitatively not qualitatively
(iii) Statistics are collected with definite purpose
(iv) Statistics in an experiment are comparable and can be classified various groups.
3. What are (i) primary data? (ii) secondary data? Which of the two – the primary or the secondary data – is more reliable and why?
Solution
The word data means information statistical data and of two types
(i) Primary data, (ii) Secondary data
(i) Primary data: when an investigator collects data himself with a definite plan or design in his (her) mind is called primary data
(ii) Secondary data: data which are not originally collected rather obtained from published or unpublished sources are known as secondary data. Secondary data are collected by an individual or an institution for some purpose and are used by someone else in another context.
Primary data are reliable and relevant because they are original in character and are collected by some individuals or by research bodies.
4. Why do we group data?
Solution
The data obtained in original form are called raw data. Raw data does not give any useful information and is rather confusing to mind. Data is grouped so that it becomes understandable can be interpreted. According to various characteristics groups are formed by us. After grouping the data, we are in position to make calculations of certain values which will help us in describing and analyzing the data.
5. Explain the meaning of the following terms:
(i) Variable
(ii) Class-integral
(iii) Class-size
(iv) Class-mark
(v) Frequency
(vi) Class limits
(vii) True class limits
Solution
(i) Variable: Any character that can vary from one individual to another is called variable or variable
(ii) Class interval: In the data each group into which raw data is considered is called a class-interval.
(iii) Class-size: The different between the true upper limit and lower limit is called the class size of that class.
(iv) Class mark: The middle value of the class is called as the class mark.
Class mark = (Upper Limit + Lower Limit)/2
(v) Frequency: The number of observations corresponding to class is called its frequency.
(vi) Class limits: Each class is bounded by two figures, called the class limits. The figures on the left side of the classes are called lower limits while figures on the right side are called upper limits.
(vii) True class limits: if classes are inclusive eg 15 - 19, 20 - 24, 25 - 29, 30 - 34 ........
Then, true lower limit of class = upper limit of class - 0.5
And true upper limit of class = upper limit of class + 0.5
Example : true limits of the class 15 - 19 are 14.5 and 19.5
But if because classes are exclusive use like 10 - 20, 20 - 30, 30 - 40 ........
Here class limits and true class limits are the same.
6. The ages of ten students of a group are given below. The ages have been recorded in years and months :
8 - 6, 9 - 0, 8 - 4, 9 - 3, 7 - 8, 8 - 11, 8 - 7, 9 - 2, 7- 10, 8 - 8
(i) What is the lowest age ?
(ii) What is the highest age ?
(iii) Determine the range ?
Solution
The ages of ten students of a group are given below
8 - 6, 9 - 0, 8 - 4, 9 - 3, 7 - 8, 8 - 11, 8 - 7, 9 - 2, 7- 10, 8 - 8
(i) Lowest age is 7 years, 8 months
(ii) Highest age is 9 years, 3 months.
(iii) Range = highest age - lowest age
= 9 year, 3 months, 7 year, 8 months
= 1 year, 7 months
7. The monthly pocket money of six friends is given below: Rs. 45, Rs.30, Rs. 40, Rs. 50, Rs. 25, Rs. 45.
(i) What is the highest pocket money?
(ii) What is the lowest pocket money?
(iii) What is the range?
(iv) Arrange the amounts of pocket money in ascending order.
Solution
The monthly pocket money of six friends is given below:
Rs. 45, Rs.30, Rs. 40, Rs. 50, Rs. 25, Rs. 45.
(i) Highest pocket money = Rs. 50
(ii) Lowest pocket money = Rs. 25
(iii) Range = 50 - 25 = 25 .
(iv) The cumulative amounts of pocket money in ascending order is
Rs. 25, Rs. 30, Rs. 40, Rs. 45, Rs. 45, Rs. 50.
8. Write the class-size in each of the following :
(i) 0 - 4, 5 -9, 10 -14
(ii) 10 - 19, 20 - 29, 30 - 39
(iii) 100 - 120, 120 - 140, 160 - 180
(iv) 0 - 0.25, 0.25 - 0.50, 0.50 - 0.75
(v) 5 - 5.01, 5.01 - 5.02, 5.02 - 5.03
Solution
(i) 0 - 4, 5 - 9, 10 - 14
True class limits are 0.5 - 4.5, 4.5 - 9.5, 9.5 - 14.5.
∴ Class size = 14.5 - 9.5 = 5
(ii) 10 - 19, 20- 29, 30 - 39
True class limits → 10.5 - 19.5, 19.5 - 29.5, 29.5 - 39.5
Class size = 39.5 - 29.5 = 10
(iii) 100 - 120, 120 - 140, 160 - 180.
Here the class limits and true class limits are the same
∴ Class size = 120 - 100 = 20
(iv) 0 - 0.25, 25 - 0.50, 0.50 - 0.75
Here the class limits and true class limits are the same
∴ Class size = 0.25 - 0 = 0.25
(v) 5 - 5.01, 5.01 - 5.02, 5.02 - 5.03.
Here the class limits and true class limits are the same
∴ Class size = 5.01 - 5.0 = 0.01.
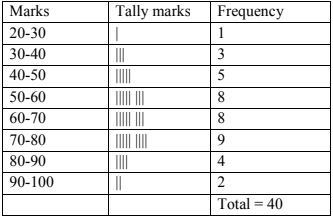
9. The final marks in mathematics of 30 students are as follows :
53, 61, 48, 60, 78, 68, 55, 100, 67, 90
75, 88, 77, 37, 84, 58, 60, 48, 62, 56
44, 58, 52, 64, 98, 59, 70, 39, 50, 60
(i) Arrange these marks in the ascending order, 30 to 39 one group, 40 to 49 second group etc. Now answer the following:
(ii) What is the highest score?
(iii) What is the lowest score?
(iv) What is the range?
(v) If 40 is the pass mark how many have failed?
(vi) How many have scored 75 or more?
(vii) Which observations between 50 and 60 have not actually appeared?
(viii) How many have scored less than 50?
Solution
The final marks in mathematics of 30 students are as follows:
53, 61, 48, 60, 78, 68, 55, 100, 67, 90, 75, 88, 77, 37, 84, 58, 60, 48, 62, 56, 44, 58, 52, 64, 98, 59, 70, 39, 50, 60.
|
(i) |
Group |
Observations |
|
I(30 – 39) |
37, 39 |
|
|
II(40 – 49) |
44, 48, 48 |
|
|
III(50 – 59) |
50, 52, 53, 55, 56, 58, 59 |
|
|
IV(60 – 69) |
60, 60, 60, 61, 62, 64, 67, 68 |
|
|
V(70 – 79) |
70, 55, 77, 78 |
|
|
VI(80 – 89) |
84, 88 |
|
|
VII(90 – 99) |
90, 98 |
|
|
VIII(100 – 109) |
100 |
(i) The weights in descending order
(ii) The highest weight = 3.1 kg
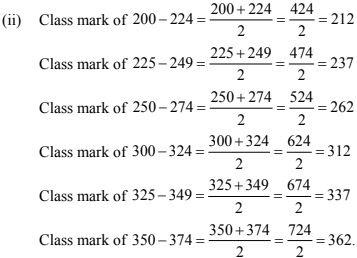
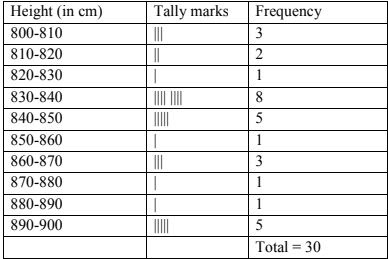
First class interval = 200 - 224
(i) Seven class intervals are :
200 - 240, 225 - 249, 250 - 274, 275 - 299, 300 - 324, 325 - 349, 350 - 374.
|
0 |
1 |
2 |
2 |
1 |
2 |
3 |
1 |
3 |
0 |
|
1 |
3 |
1 |
1 |
2 |
2 |
0 |
1 |
2 |
1 |
|
3 |
0 |
0 |
1 |
1 |
2 |
3 |
2 |
2 |
0 |
|
Number of heads |
Number of times (frequency) |
|
0 |
6 |
|
1 |
10 |
|
2 |
9 |
|
3 |
5 |
|
Total |
30 |
1 | 6 | 2 | 3 | 5 | 12 | 35 | 8 | 4 | 8 |
10 | 3 | 4 | 12 | 2 | 8 | 15 | 1 | 17 | 6 |
3 | 2 | 8 | 5 | 9 | 6 | 8 | 7 | 14 | 12 |
The grouped frequency distribution table is as follows
Hours | Number of children |
0 - 5 | 10 |
5 - 10 | 13 |
10 - 15 | 5 |
15 - 20 | 2 |
Total | 30 |
(ii) The number of children, who watched TV for 15 or more hours a week is 2(i.e., number of children in class interval 15 - 20).
