RS Aggarwal Solutions Chapter 9 Mean, Mode and Median MCQ Class 10 Maths

Chapter Name | RS Aggarwal Chapter 9 Mean, Mode and Median |
Book Name | RS Aggarwal Mathematics for Class 10 |
Other Exercises |
|
Related Study | NCERT Solutions for Class 10 Maths |
Mean, Mode and Median MCQ Solutions
1. Which of the following is not a measure of central tendency?
(a) Mean
(b) Mode
(c) Median
(d) Standard Deviation
Solution
(d) Standard Deviation
The standard deviation is a measure of dispersion. It is the action or process of distributing thing over a wide area (nothing about central location).
2. Which of the following cannot be determined graphically?
(a) Mean
(b) Median
(c) Mode
(d) None of these
Solution
(a) Mean
The mean cannot be determined graphically because the values cannot be summed.
3. Which of the following measures of central tendency is influence by extreme values?
(a) Mean
(b) Median
(c) Mode
(d) None of these
Solution
(a) Mean
Mean is influenced by extreme values.
4. The mode of frequency distribution is obtained graphically from
(a) a frequency curve
(b) a frequency polygon
(c) a histogram
(d) an ogive
Solution
(c) a histogram
The mode of a frequency distribution can be obtained graphically from a histogram.
5. The medium of a frequency distribution is found graphically with the help of
(a) a histogram
(b) a frequency curve
(c) a frequency polygon
(d) ogives
Solution
(d) ogives
This because median of a frequency distribution is found graphically with the help of ogives.
6. The cumulative frequency table is useful is determining the
(a) Mean
(b) Median
(c) Mode
(d) all of these
Solution
(b) Median
The cumulative frequency table is useful in determining the median.
7. The abscissa of the point of intersection of the Less Than Type and of the More Than Type cumulative frequency curves of a grouped data gives its
(a) Mean
(b) Median
(c) Mode
(d) None of these
Solution
(b) Median
The abscissa of the point of intersection of the ‘less than type’ and that of the ‘more than type’ cumulative frequency curves of a grouped data gives its median.
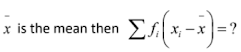
8. If xi ’s are the midpoints of the class intervals of a group data, fi ’s are the corresponding frequencies and
(a) 1
(b) 0
(c) -1
(d) 2
Solution (b) 0
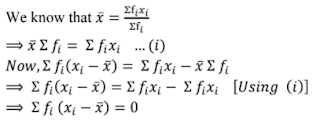
 we have ui = ?
(a) (A – xi)/h
(b) (xi – A)/h
(c) (A + xi)/h
(d) h(xi – A)
Solution
(b) ui = (xi – A)/h
ui = (xi – A)/h
10. In the formula,
di ‘s are the deviations from A of
(a) lower limits of the classes
(b) upper limits of the classes
(c) midpoints of the classes
(d) none of these
Solution
(c) midpoints of the classes
The di ‘s are the deviations from A of midpoints of the classes.
11. While computing the mean of the group data, we assume that the frequencies are
(a) evenly distributed over the classes
(b) centred at the class marks of the classes
(c) centred at the lower limits of the classes
(d) centred at the upper limits of the classes
Solution
(b) centred at the class marks of the classes
While computing the mean of the group data, we assume that the frequencies are centred at the class marks of the classes.
12. The relation between mean, mode and median is
(a) mode = (3×mean) – (2×median)
(b) mode = (3×median) – (2×mean)
(c) median = (3×mean) – (2×mode)
(d) mean = (3×median) – (2×mode)
Solution
(b) mode = (3 × median) – (2 × mean)
mode = (3 × median) – (2 × mean)
13. If the ‘less than type’ ogive and ‘more than type’ ogive intersect each other at (20.5, 15.5) then the median of the given data is
(a) 5.5
(b) 15.5
(c) 20.5
(d) 36.0
Solution
(c) 20.5
The x- coordinate represents the median of the given data.
Thus, median of the given data is 20.5.
14. Consider the frequency distribution of the heights of 60 students of a class
Height (in cm) | No. of students | Cumulative frequency |
150 - 155 | 16 | 16 |
155 - 160 | 12 | 28 |
160 - 165 | 9 | 37 |
165 - 170 | 7 | 44 |
170 - 175 | 10 | 54 |
175 - 180 | 6 | 60 |
The sum of the lower limit of the modal class and the upper limit of the median class is
(a) 310
(b) 315
(c) 320
(d) 330
Solution
(b) 315
The class having the maximum frequency is the modal class.
So, the modal class is 150 – 155 and its lower limit is 150.
Also, N = 60
⇒ N/2 = 30
The cumulative frequency just more than 30 is 37 and its 160 – 165, whose upper limit is 165.Class | 0 - 10 | 10 - 20 | 20 - 30 | 30 - 40 | 40 - 50 | 50 - 60 |
Frequency | 3 | 9 | 15 | 30 | 18 | 5 |
The modal class is
(a) 10 - 20
(b) 20 - 30
(c) 30 - 40
16. Mode = ?
(a) xk + h{(fk - 1 – fk)/(2fk – fk-1 – fk + 1)
(b) xk + h {fk – fk-1)/(2fk – fk-1 – fk+1}
(c) xk + h {(fk – fk – 1)/(fk – 2fk - 1 – fk+1)}
(d) xk + h{(fk – fk-1)/(fk – fk-1 – 2fk+1)}
Solution (b) xk + h {fk – fk -1)/(2fk – fk-1 – fk+ 1)}
xk + h {fk – fk -1)/(2fk – fk-1 – fk+ 1)}
17. Median = ?
(a) l + {h × (N/2 – cf)/f}
(b) l + {h × (cf – N/2)/f}
(c) l – {h × (N/2 – cf)/f}
(d) None of these
Solution
(a) l × {h × (N/2 – cf)/f}
l × {h × (N/2 – cf)/f}
18. If the mean and median of a set of numbers are 8.9 and 9 respectively, then the mode will be
(a) 7.2
(b) 8.2
(c) 9.2
(d) 10.2
Solution
(c) 9.2
It is given that the mean and median are 8.9 and 9, respectively,
∴ Mode = (3 × Median) – (2 × Mean)
⇒ Mode = (3 × 9) – (2 × 8.9)
= 27 – 17.8
= 9.2
19. Look at the frequency distribution table given below:
Class interval | 35 - 45 | 45 - 55 | 55 - 65 | 65 - 75 |
Frequency | 8 | 12 | 20 | 10 |
The median of the above distribution is
(a) 56.5
(b) 57.5
(c) 58.5
(d) 59
Solution
(b) 57.5
Class interval | 35 - 45 | 45 - 55 | 55 - 65 | 65 - 75 |
Frequency | 8 | 12 | 20 | 10 |
Cumulative frequency | 8 | 20 | 40 | 50 |
Here, N = 50
⇒ N/2 = 25, which lies in the class interval of 55 – 65.
Now, cf = 55, f = 20 and l = 50
∴ Median = l + {ℎ × (N/2 – cf)/f}
= 50 + (65 – 55)/20 × (25 – 20)
= 57.5
Class interval | 10 - 14 | 14 - 18 | 18 - 22 | 22 - 26 | 26 - 30 |
Frequency | 5 | 11 | 16 | 25 | 19 |
The mode of the above data is
(a) 23. 5
(b) 24
(c) 24.4
(d) 25
Solution
(c) 24.4
The maximum frequency is 25 and the modal class is 22 - 26.
Now, xk = 22, fk = 25, fk-1 = 16, f k+1 = 19 and h = 4
∴ Mode = xk + h {(fk – fk-1)/(2fk – fk-1 – fk+1)}
= 22 + 4 × (25 – 16)/(2 × 25 − 16 − 19)
= 22 + 4 × (25 – 16)/(50 – 16 − 19)
= 22 + 4 × 9/15
= 22 + 12/5
= 22 + 2.4
= 24.4
21. The mean and mode of a frequency distribution are 28 and 16 respectively. The median is
(a) 22
(b) 23.5
(c) 24
(d) 24.5
Solution
(c) 24
Mode = (3 × median) – (2 × mean)
⇒ (3 × median) = (mode + 2 mean)
⇒ (3 × median) = 16 + 56
⇒ (3 × median) = 72
⇒ Median = 72/3
∴ Median = 24
22. The median and mode of a frequency distribution are 26 and 29 respectively. Then, the mean is
(a) 27.5
(b) 24.5
(c) 28.4
(d) 25.8
Solution
(b) 24.5
Mode = (3 × median) – (2 × mean)
⇒ (2 × mean) = (3 × median) – mode
⇒ (2 × mean) = 3 × 26 – 29
⇒ (2 × mean) = 49
⇒ Mean = 49/2
∴ Mean = 24.5
23. For a symmetrical frequency distribution, we have:
(a) mean ˂ mode ˂ median
(b) mean > mode > median
(c) mean = mode = median
(d) mode = 1/2 (mean + median)
Solution
(c) mean = mode = median
A symmetric distribution is one where the left and right hand sides of the distribution are roughly equally balanced around the mean.
24. Look at the cumulative frequency distribution table given below:
Monthly income | No. of families |
More than ₹ 10000 | 100 |
More than ₹ 10000 | 85 |
More than ₹ 10000 | 69 |
More than ₹ 10000 | 50 |
More than ₹ 10000 | 37 |
More than ₹ 10000 | 15 |
Number of families having income range 20000 to 25000 is
(a) 19
(b) 16
(c) 13
(d) 22
Solution
(c) 13
Converting the given data into a frequency table, we get:
Monthly income | No. of families | Frequency |
30,000 and above | 15 | 15 |
25,000 – 30,000 | 37 | (37 – 15) = 22 |
20,000 – 25,000 | 50 | (50 – 37) = 13 |
18,000 – 20,000 | 69 | (69 – 50) = 19 |
14,000 – 18,000 | 85 | (85 – 69) = 16 |
10,000 – 14,000 | 100 | (100 – 85) = 15 |
Hence, the number of families having an income range of Rs. 20,000 – Rs. 25,000 is 13.
The correct option is (c).
25. The median of the first 8 prime numbers is
(a) 7
(b) 9
(c) 11
(d) 13
Solution
(b) 9
First 8 prime numbers are 2, 3, 5, 7, 11, 13, 17 and 19.
Median of 8 numbers is average of 4th and 5th terms.
i.e., average of 7 and 11
Thus, the median is 9.
26. The mean of 20 numbers is 0. OF them, at the most, how many may be greater than zero?
(a) 0
(b) 1
(c) 10
(d) 19
Solution
(d) 19
It is given that mean of 20 numbers is zero.
i.e., average of 20 numbers is zero.
i.e., sum of 20 numbers is zero.
Thus, at most, there can be 19 positive numbers.
(such that if sum of 19 positive numbers is x, 20th number will be –x.
27. If the median of the data 4, 7, x-1, x-3, 16, 25, written in ascending order, is 13 then x is equal to
(a) 13
(b) 14
(c) 15
(d) 16
Solution
(c) 15
Median of 6 numbers is the average of 3rd and 4th term.
∴ 13 = {(x – 1) + (x + 3)}/2
⇒ 26 = 2x – 4
⇒ 2x = 30
⇒ x = 15
Thus, x is equal to 15.
28. The mean of 2, 7, 6 and x is 15 and mean of 18, 1, 6, x and y is 10. What is the value of y?
(a) 5
(b) 10
(c) -20
(d) 30
Solution
(c) -20
Mean = (sum of observations)/(number of observations)
⇒ 15 = (2 + 7 + 6 + x)/4
⇒ 60 = 15 + x
⇒ x = 45 ….(1)
Now,
Mean = (sum of observations)/(number of observations)
⇒ 10 = (18 + 1 + 6 + x + y)/5
⇒ 50 = 25 + x + y
⇒ y = 25 – x
⇒ y = 25 – 45 [From (1)]
⇒ y = -20
29. Match the following:
Column I | Column II |
(a) The most frequent value in a data is known as......... | (p) standard deviation |
(b) which of the following cannot be determined graphically out of mean, mode and median? | (q) median |
(c) An ogive is used to determine ........ | (r) mean |
(d) out of mean, mode, median and standard deviation, which is not a measure of tendency? | (s) mode |
Solution
Column I | Column II |
(a) The most frequent value in a data is known as .......... | (s) mode |
(b) Which of the following cannot be determined graphically out of mean, mode and median? | (r) mean |
(c) An ogive is used to determine....... | (q) median |
(d) out of mean, mode, median and standard deviation, which is not a measure of tendency ? | (p) standard deviation |
(a) Both Assertion (A) and reason (R) are true and Reason (R) is a correct explanation of Assertion (A).
(b) Both Assertion (A) and reason (R) are true and Reason (R) is not a correct explanation of Assertion (A).
(c) Assertion (A) is true and Reason (R) is false.
(d) Assertion (A) is false and Reason (R) is true.
Assertion (A) | Reason (R) |
If the median and mode of a frequency distribution are 150 and 154 respectively, then its | Mean, median and mode of a frequency distribution are related as: Mode = (3 median) – (2 mean) |
Solution
(a) Both Assertion (A) and reason (R) are true and Reason (R) is a correct explanation of Assertion (A).
Clearly, reason (R) is true.
Using the relation in reason (R), we have:
2 mean = (3 × median) – mode = (3 × 150) – 154 = 450 – 154 = 296
⇒ Mean = 148, which is true.
∴ This assertion (A) and reason (R) are both true and reason (R) is the correct explanation of assertion (A).
31. Question consists of two statements, namely, Assertion (A) and Reason (R). For selecting the correct answer, use the following code:
(a) Both Assertion (A) and reason (R) are true and Reason (R) is a correct explanation of Assertion (A).
(b) Both Assertion (A) and reason (R) are true and Reason (R) is not a correct explanation of Assertion (A).
(c) Assertion (A) is true and Reason (R) is false.
(c) Assertion (A) is false and Reason (R) is true.
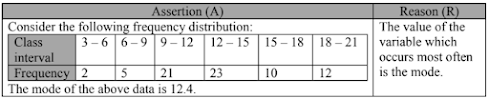
Solution
(b) Both assertion (A) and reason (R) are true, but reason (R) is not a correct explanation of assertion (A).
Clearly, reason (R) is true.
The maximum frequency is 23 and the modal class is 12 – 15.
Now, xk = 12, fk = 23, fk-1= 21, fk+1 = 23 and h = 3
∴ Mode = {12 + 3 × (23 − 21)/(2 × 23 – 21 − 10)}
= (12 + 3 × 2/15)
= (12 + 0.4)
= 12
∴ Assertion (A) is true.
However, reason (R) is not a correct explanation of assertion (A).