RD Sharma Solutions Chapter 7 Statistics Exercise 7.5 Class 10 Maths

Chapter Name | RD Sharma Chapter 7 Statistics |
Book Name | RD Sharma Mathematics for Class 10 |
Other Exercises |
|
Related Study | NCERT Solutions for Class 10 Maths |
Exercise 7.5 Solutions
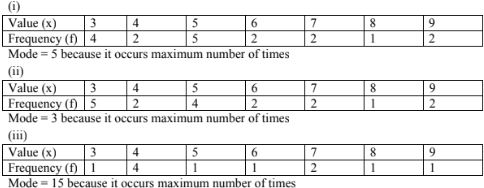
1. Find the mode of the following data:
(i) 3,5,7,4,5,3,5,6,8,9,5,3,5,3,6,9,7,4
(ii) 3,3,7,4,5,3,5,6,8,9,5,3,5,3,6,9,7,4
(iii) 15,8,26,25,24,15,18,20,24,15,19,15
Solution
2. The shirt sizes worn by a group of 200 persons, who bought the shirt from a store, are as follows:
|
Shirt size: |
37 |
38 |
39 |
40 |
41 |
42 |
43 |
44 |
|
Number of persons: |
15 |
25 |
39 |
41 |
36 |
17 |
15 |
12 |
Find the model shirt size worn by the group.
Solution
Shirt size: | 37 | 38 | 39 | 40 | 41 | 42 | 43 | 44 |
Frequency (f) | 15 | 25 | 39 | 41 | 36 | 17 | 15 | 12 |
Model shirt size = 40 because it occurs maximum number of times
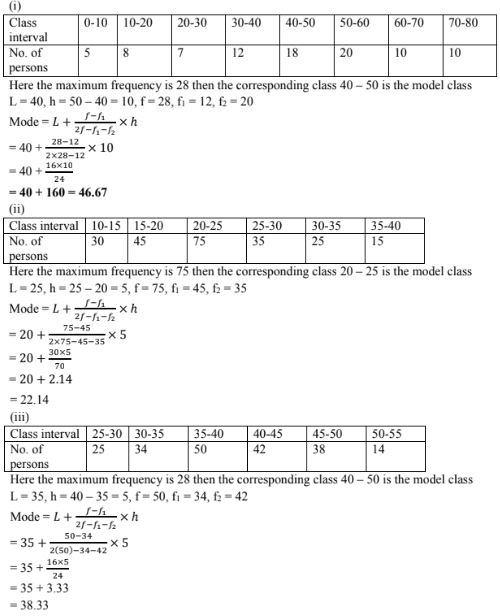
(i)
|
Class interval: |
0 – 10 |
10 – 20 |
20 – 30 |
30 – 40 |
40 – 50 |
50 – 60 |
60 – 70 |
70 – 80 |
|
Frequency: |
5 |
8 |
7 |
12 |
28 |
20 |
10 |
10 |
(ii)
|
Class – inteval: |
10 – 15 |
15 – 20 |
20 – 25 |
25 – 30 |
30 – 35 |
35 – 40 |
|
Frequency: |
30 |
45 |
75 |
35 |
25 |
15 |
(iii)
|
Class – interval: |
25 – 30 |
30 – 35 |
35 – 40 |
40 – 45 |
45 – 50 |
50 – 60 |
|
Frequency: |
25 |
34 |
50 |
42 |
38 |
14 |
Solution
|
Age(in years): |
16 – 18 |
18 – 20 |
20 – 22 |
22 – 24 |
24 – 26 |
|
Group A |
50 |
78 |
46 |
28 |
23 |
|
Group B |
54 |
89 |
40 |
25 |
17 |
Solution
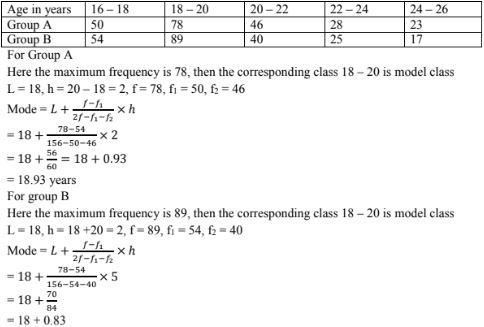
= 18.83
Hence the mode of age for the group A is higher than group B.
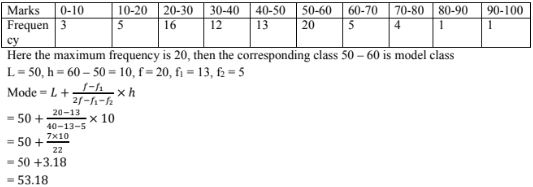
|
Marks: |
0 – 10 |
10 – 20 |
20 – 30 |
30 – 40 |
40 – 50 |
50 – 60 |
60 – 70 |
70 – 80 |
80 – 90 |
90 – 100 |
|
Frequency: |
3 |
5 |
16 |
12 |
13 |
20 |
5 |
4 |
1 |
1 |
Solution
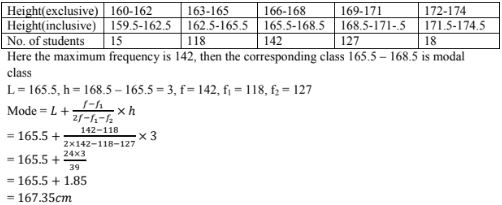
|
Height(in cm): |
160 – 162 |
163 – 165 |
166 – 168 |
169 – 171 |
172 – 174 |
|
No. of students: |
15 |
118 |
142 |
127 |
18 |
Find the average height of maximum number of students.
Solution
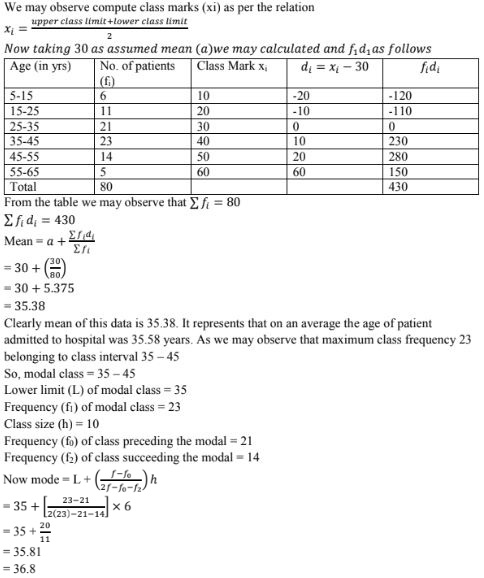
|
Age(in years): |
5 – 15 |
15 – 25 |
25 – 35 |
35 – 45 |
45 – 55 |
55- 65 |
|
No. of students: |
6 |
11 |
21 |
23 |
14 |
5 |
Find the mode and the mean of the data given above. Compare and interpret the two measures of central tendency.
Solution
8. The following data gives the information on the observed lifetimes (in hours) of 225 electrical components:
|
Lifetimes (in hours): |
0 – 20 |
20 – 40 |
40 – 60 |
60 – 80 |
80 – 100 |
100 – 120 |
|
No. of components: |
10 |
35 |
52 |
61 |
38 |
29 |
Determine the modal lifetimes of the components.
Solution
From data as given above we may observe that maximum class frequency 61 belonging to
class interval 60 - 80.
So, modal class 60 - 80 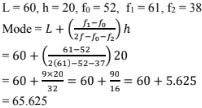
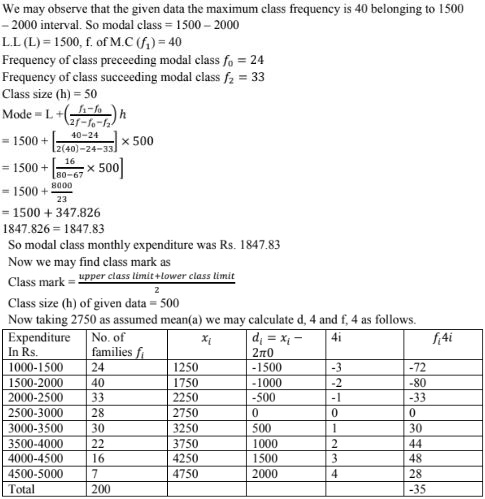
9. The following data gives the distribution of total monthly houshold expenditure of 200 families of a village. Find the modal monthly expenditure of the families.Also, find the mean monthly expenditure:
|
Expenditure (in Rs.) |
Frequency |
Expenditure(in Rs.) |
Frequency |
|
1000 – 1500 |
24 |
3000 – 3500 |
30 |
|
1500 – 2000 |
40 |
3500 – 4000 |
22 |
|
2000 – 2500 |
33 |
4000 – 4500 |
16 |
|
2500 – 3000 |
28 |
4500 – 5000 |
7 |
Solution
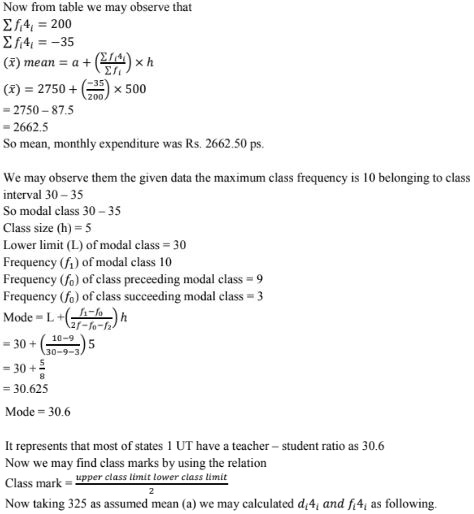
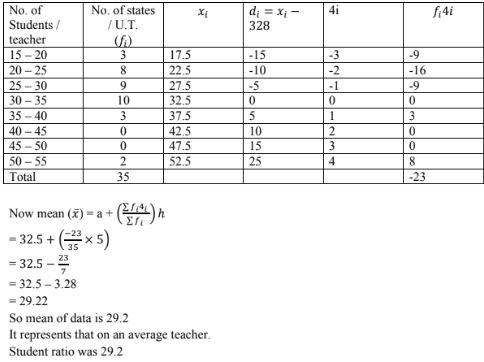
|
Number of students per teacher |
Number of states/U.T. |
Number of students per teacher |
Number of states/U.T. |
|
15 – 20 |
3 |
35 – 40 |
3 |
|
20 – 25 |
8 |
40 – 45 |
0 |
|
25 – 30 |
9 |
45 – 50 |
0 |
|
30 – 35 |
10 |
50 – 55 |
2 |
Solution
|
Runs scored |
No. of batsman |
Runs scored |
No. of batsman |
|
3000 – 4000 |
4 |
7000 – 8000 |
6 |
|
4000 – 5000 |
18 |
8000 – 9000 |
3 |
|
5000 – 6000 |
9 |
9000 – 10000 |
1 |
|
6000 – 7000 |
7 |
10000 – 11000 |
1 |
Find the mode of the data.
Solution
From the given data we may observe that maximum class frequently is 18 belonging to
class interval 4000 - 5000
So modal class 4000 - 5000
Lower limit(1) of model class = 4000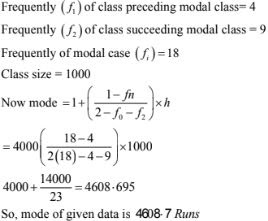
12. A student noted the number of cars passing through a spot on a road for loo periods each of 3 minutes and summarized it in the table given below. Find the mode of the data:
Solution
From the given data we may observe that maximum class internal frequency is 200 belonging to modal class = 40 - 50 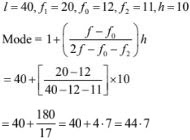
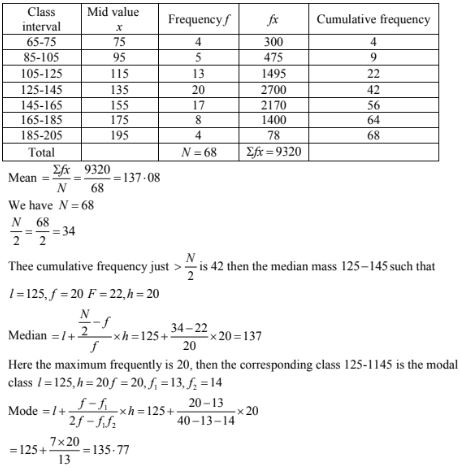
13. The following frequency distribution gives the monthly consumption of electricity of 68 consumers of a locality. Find the median, mean and mode of the data the compare them.
|
Monthly consumption(in units) |
65 – 85 |
85 – 105 |
105 – 125 |
125 – 145 |
145 – 165 |
165 – 185 |
185 – 205 |
|
No. of consumers: |
4 |
5 |
13 |
20 |
14 |
8 |
4 |
Solution
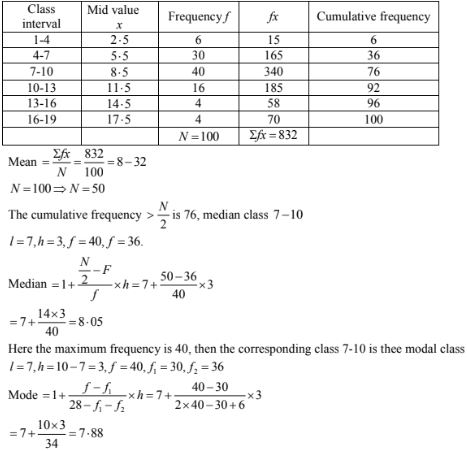
|
Number of letters: |
1 – 4 |
4 – 7 |
7 – 10 |
10 – 13 |
13 – 16 |
16 – 19 |
|
Number surnames: |
6 |
30 |
40 |
16 |
4 |
4 |
Determine the median number of letters in the surnames. Find the mean number of letters in the surnames. Also, find the modal size of the surnames.
Solution
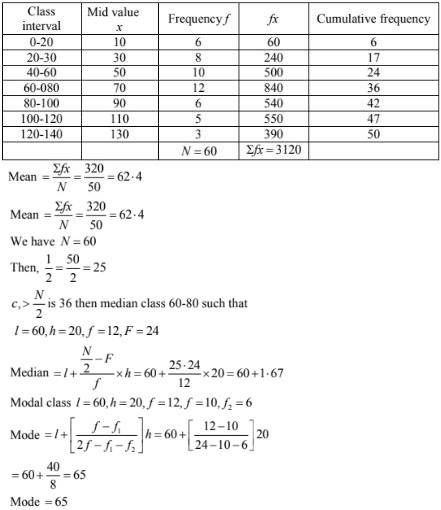
|
Classes: |
0 – 20 |
20 – 40 |
40 – 60 |
60 – 80 |
80 – 100 |
100 – 120 |
120 – 140 |
|
Frequency: |
6 |
8 |
10 |
12 |
6 |
5 |
3 |
Solution
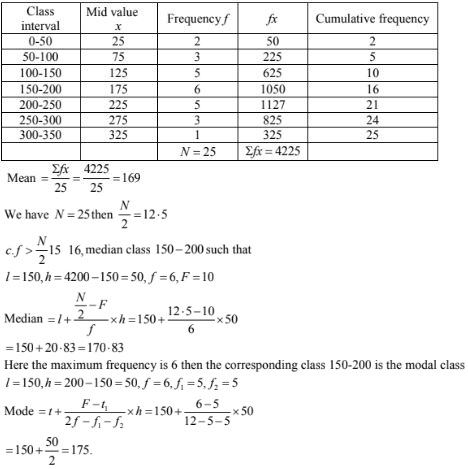
|
Classes : |
0 – 50 |
50 – 100 |
100 – 150 |
150 – 200 |
200 – 250 |
250 – 300 |
300 – 350 |
|
Frequency: |
2 |
3 |
5 |
6 |
5 |
3 |
1 |
Solution
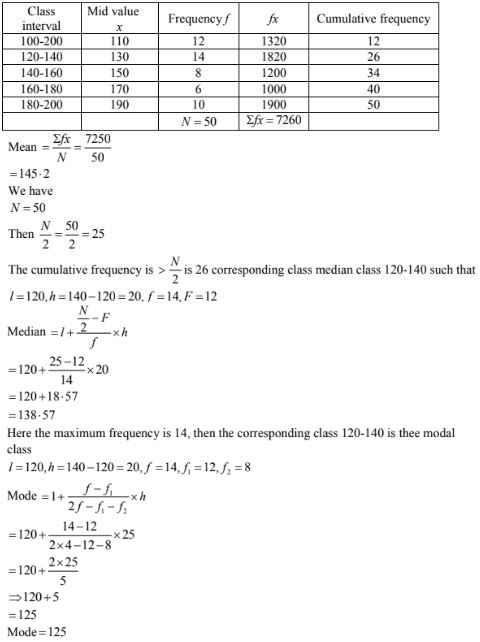
|
Daily income(in Rs) |
100 – 120 |
120 – 140 |
140 – 160 |
160 – 180 |
180 – 200 |
|
Number of workers: |
12 |
14 |
8 |
6 |
10 |
Find the mean, mode and median of the above data.
Solution