Selina Concise Solutions for Chapter 22 Data Handling Class 8 ICSE Mathematics

Exercise 22A
(i) 7, 5, 15, 12, 10, 11, 16
(ii) 6.3, 5.9, 9.8, 12.3, 5.6, 4.7
Solution
(i) Ascending order = 5, 7, 10, 11, 12, 15, 16
(ii) Ascending order = 4.7, 5.6, 5.9, 6.3, 9.8, 12.3
2. Arrange the following data as an array (descending order):
(i) 0 2, 0, 3, 4, 1, 2, 3, 5
(ii) 9.1, 3.7, 5.6, 8.3, 11.5, 10.6
Solution
(i) Descending order = 5, 4, 3, 3, 2, 2, 1, 0
(ii) Descending order = 11.5, 10.6, 9.1, 8.3, 5.6, 3.7
3. Construct a frequency table for the following data:
(i) 6, 7, 5, 6, 8, 9, 5, 5, 6, 7, 8, 9, 8, 10, 10, 9, 8, 10, 5, 7, 6, 8.
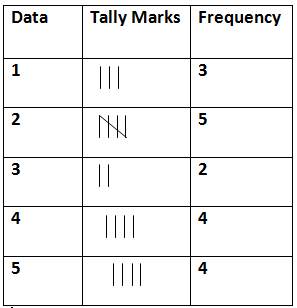
(ii) 3, 2, 1, 5, 4, 3, 2, 5, 5, 4, 2, 2, 2, 1, 4, 1, 5, 4.
Solution
(i)

(ii)
4. Following are the marks obtained by 30 students in examinations.
15, 20, 8, 9, 10,
16, 17, 20, 24, 30,
44, 47, 38, 36, 40,
27, 25, 28, 30, 19,
7, 11, 21, 31, 41,
37, 47, 23, 20, 17
Taking class intervals 0-10, 10-20, ……… 40-50 ; construct a frequency table.
Solution
5. Construct a frequency distribution table for the following data; taking class-intervals 4-6, 6-8, …… 14-16.
11.5, 6.3, 7.8, 9.2, 10.5, 4.5, 6, 8.3, 12.5, 15.8,
7.4, 5.3, 8.4, 15.2, 8.9, 9.8, 8.25, 6.5, 5.8, 10.5,
4.6, 6.4, 8.9, 10.8, 12.7, 14.2, 15.3, 11.7, 9.9, 8.8,
6.6, 4.3, 4.7, 9.4, 10.1, 15.5, 14.4, 12.2, 7.7, 5.5
Solution7.4, 5.3, 8.4, 15.2, 8.9, 9.8, 8.25, 6.5, 5.8, 10.5,
4.6, 6.4, 8.9, 10.8, 12.7, 14.2, 15.3, 11.7, 9.9, 8.8,
6.6, 4.3, 4.7, 9.4, 10.1, 15.5, 14.4, 12.2, 7.7, 5.5

6. Fill in the blanks:
(i) Lower class limit of 15-18 is ………
(ii) Upper class limit of 24-30 is ……..
(iii) Upper limit of 5-12.5 is ………
(iv) If the upper and the lower limits of a class interval are 16 and 10; the class-interval is ……..
(v) If the lower and the upper limits of a class interval are 7.5 and 12.5; the class interval is ……..
Solution
(i) Lower class limit of 15 – 18 is 15.
(ii) Upper class limit of 24 – 30 is 30.
(iii) Upper limit of 5 – 12.5 is 12.5
(iv) If the upper and lower limits of a class interval are 16 and 10; the class interval is 10 – 16
(v) If the lower and upper limits of a class interval are 7.5 and 12.5; the class interval is 7.5 – 12.5
Exercise 22B
1. Hundred students from a certain locality use different modes of travelling to school as given below. Draw a bar graph.

2. Mr. Mirza’s monthly income is Rs. 7,200. He spends Rs. 1,800 on rent, Rs. 2,700 on food, Rs. 900 on education of his children ; Rs. 1,200 on Other things and saves the rest.
Draw a pie-chart to represent it.
Solution


3. The percentage of marks obtained, in different subjects by Ashok Sharma (in an examination) are given below. Draw a bar graph to represent it.


4. The following table shows the market position of different brand of tea-leaves.
Solution


Solution

6. For the following table, draw a bar-graph

Solution


Solution

8: For the data given above in question number 7, draw a suitable pie-graph.
Solution
∵ 60 + 45 + 42 + 48 + 75 = 270
∴ Central angle for Hindi = 60/270 × 360˚ = 80˚
Central angle for English = 45/270 × 360˚ = 60˚
Central angle for Maths = 42/270 × 360˚ = 45˚
Central angle for Hindi = 48/270 × 360˚ = 64˚
And Central angle Social study = 72/270 × 360˚ = 100˚

9. Mr. Kapoor compares the prices (in Rs.) of different items at two different shops A and B. Examine the following table carefully and represent the data by a double bar graph.


10: The following tables shows the mode of transport used by boys and girls for going to the same school.

Solution
